USD/CAD Price Forecast: Seems vulnerable near 100-day SMA; focus remains on Trump’s tariffs
- USD/CAD prolongs its weekly downtrend for the third successive day on Wednesday.
- Reports that Canada may face the lowest tier of the April 2 US tariffs benefit the CAD.
- Bullish Oil prices also underpin the Loonie, though USD dip-buying supports the pair.

The USD/CAD pair attracts sellers for the third consecutive day and drops to a nearly three-week low, around the mid-1.4200s during the first half of the European session on Wednesday. The Canadian Dollar (CAD) draws some support from reports that Canada could be on the lower end of US President Donald Trump’s threatened global tariffs next week. Furthermore, Crude Oil prices stand firm near the highest level in over three weeks, which is seen as another factor underpinning the commodity-linked Loonie and exerting downward pressure on the currency pair.
The American Petroleum Institute (API) reported a significant drawdown in US inventories during the week ending March 21. Moreover, Trump imposed a secondary tariff on Venezuela and said that any country that buys oil or gas from Venezuela would face a 25% tariff when trading with the US. This raises supply-side concerns and acts as a tailwind for Oil prices. Meanwhile, Russia and Ukraine have reached an agreement to halt military strikes in the Black Sea and on energy infrastructure following negotiations mediated by the US, which might cap Crude Oil prices.
This, along with the emergence of some US Dollar (USD) dip-buying, could limit deeper losses for the USD/CAD pair. Market caution grows ahead of Trump's so-called reciprocal tariff announcement on April 2 and lifts the safe-haven buck back closer to a nearly three-week high touched on Tuesday. Any meaningful USD appreciation, however, seems limited in the wake of rising bets that the Federal Reserve (Fed) will resume its rate-cutting cycle soon amid increasing pessimism about the US economy, which led to a sharp downturn in the US consumer confidence.
In fact, the Conference Board's survey showed on Tuesday that the US Consumer Confidence Index fell for the fourth straight month, to a four-year low level of 92.9 in March. Adding to this, the Expectations Index fell to 65.2, or the lowest level in 12 years, and well below the threshold of 80 which usually signals a recession ahead. Furthermore, a generally positive tone around the equity markets might cap gains for the safe-haven buck. The USD bulls also seem reluctant and might opt to wait for the release of the US Personal Consumption Expenditure (PCE) Price Index on Friday.
In the meantime, Wednesday's economic docket – featuring Durable Goods Orders data – and speeches by influential FOMC members could drive the USD demand. This, along with Oil price dynamics, should provide some impetus to the USD/CAD pair. Nevertheless, the aforementioned fundamental backdrop suggests that the path of least resistance for spot prices is to the downside and any attempted recovery could be seen as a selling opportunity.
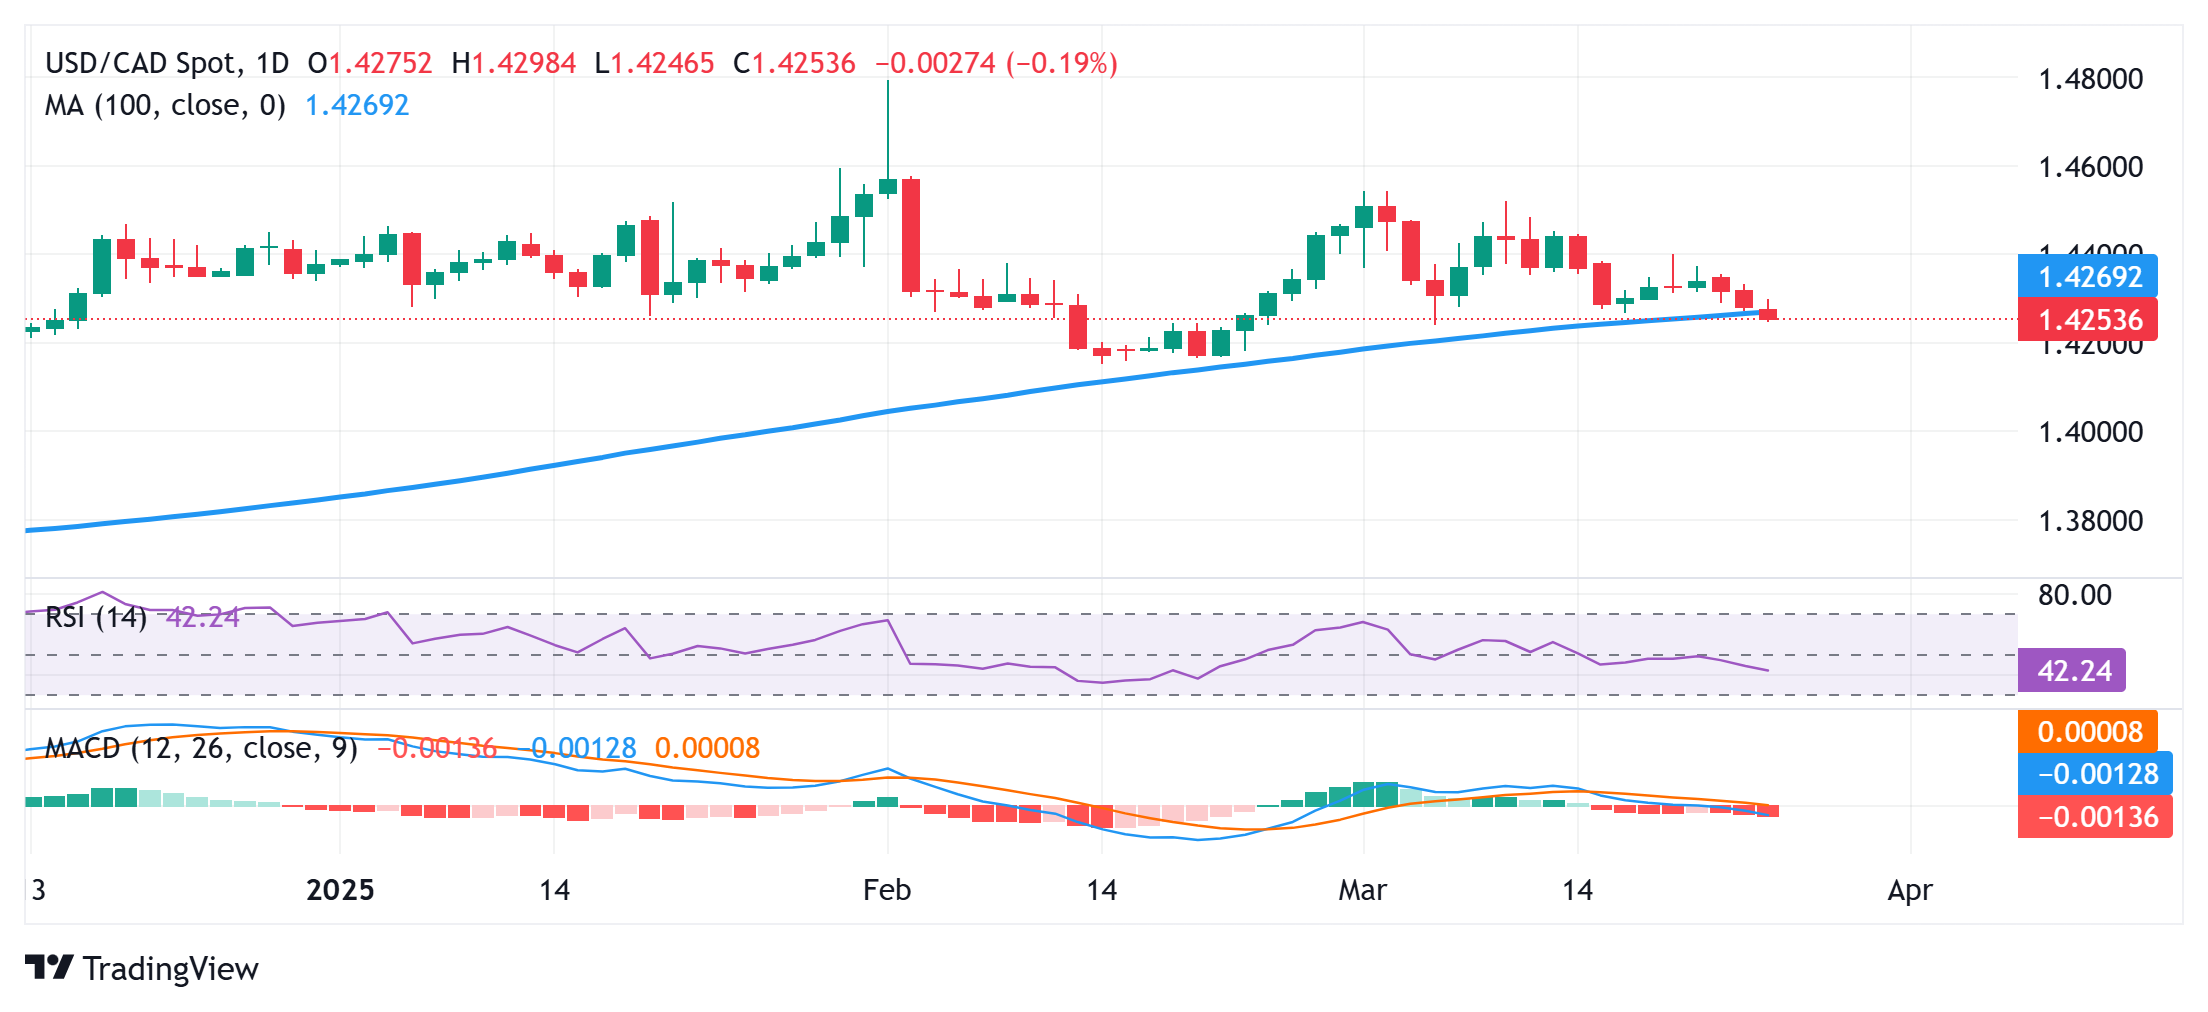
USD/CAD daily chart
Technical Outlook
From a technical perspective, the USD/CAD pair is currently placed near the 100-day Simple Moving Average (SMA). Given that oscillators on the daily chart have just started gaining negative traction, a convincing break and acceptance below the said support could make spot prices vulnerable to prolonging the downtrend. The subsequent fall could extend towards the 1.4200 mark en route to the 1.4150 area, or the year-to-date low touched on February 14.
On the flip side, the 1.4300 round figure, or the daily swing high, now seems to act as an immediate hurdle. A sustained strength beyond could trigger a short-covering rally and lift the USD/CAD pair to the 1.4350 intermediate resistance en route to last week's swing high, around the 1.4400 mark. The next relevant barrier is pegged near the 1.4435-1.4440 area, which if cleared might shift the bias in favor of bullish traders and pave the way for additional gains.
Author

Haresh Menghani
FXStreet
Haresh Menghani is a detail-oriented professional with 10+ years of extensive experience in analysing the global financial markets.