USD/CAD Forecast: Holds above the accelerated trendline, eyes re-test of 1.30

The USD/CAD's retreat from 1.30 to 1.2803 indicates a temporary top is in place at the psychological hurdle, however, short-term bearish reversal is seen only below the accelerated trendline.
Daily chart
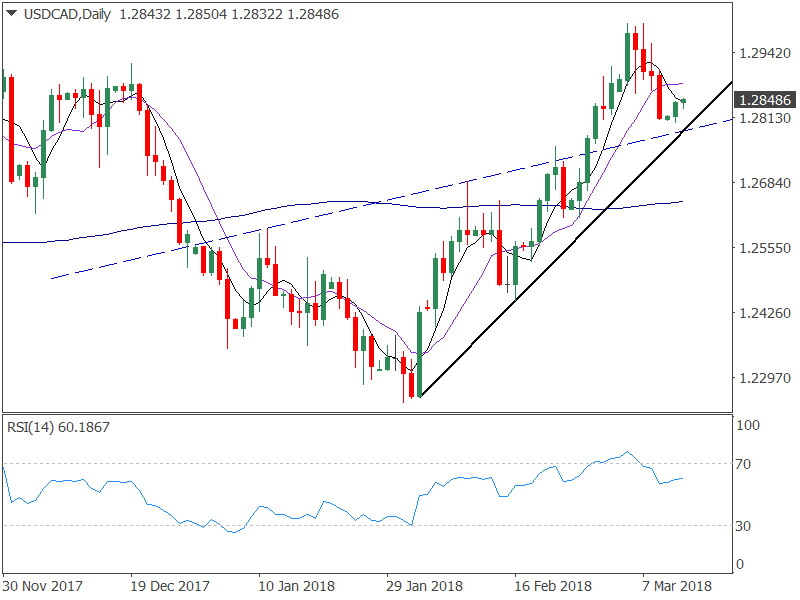
Bearish 5-day moving average (MA) and 10-day MA cross indicate a short-term bearish setup. However, the spot remains above the ascending trendline (drawn from the Feb. 2 low and Feb. 16 low). Further, the pair also trades above the inverse head-and-shoulders neckline. Also, it is worth noting that the inverse head-and-shoulders breakout confirmed on Feb. 27 had opened doors for a rally to 1.3230 (target as per the measured height method).
Meanwhile, on the dailies, the relative strength index (RSI) remains above 50.00 (in the bullish territory) and on the weekly chart, the indicator is biased bullish. The 5-week MA and the 10-week MA are biased bullish as well.
On the 4-hour chart, the 5-MA and 10-MA are curled up in favor of the bulls and the RSI has bottomed out around 35.00.
So, the pair will likely hold the ascending trendline and revisit 1.30 soon. A daily close above the psychological mark would allow a stronger rally to 1.3230 (inverse head-and-shoulders target).
Only a daily close below the neckline support (former resistance) could yield a drop to 1.2646 (100-day moving average).
Author

Omkar Godbole
FXStreet Contributor
Omkar Godbole, editor and analyst, joined FXStreet after four years as a research analyst at several Indian brokerage companies.


