USD/CAD Forecast: Bears await break below 50-day SMA/61.8% Fibo. confluence support
- USD/CAD consolidates its recent heavy losses to a multi-week trough touched on Friday.
- Middle East tensions boost Oil prices, underpinning the Loonie and capping spot prices.
- The downside remains cushioned ahead of the crucial US inflation figures due this week.

The USD/CAD pair struggles to gain any meaningful traction at the start of a new week and remains well within the striking distance of a three-week low, around the 1.3720-1.3715 region touched on Friday. Crude Oil prices preserve last week's strong gains of over 3% amid rising geopolitical tensions in the Middle East, which is seen underpinning the commodity-linked Loonie and acting as a headwind for the currency pair. The Israeli intelligence community believed that Iran has decided to attack Israel directly and may do so within days in retaliation for the assassination of Hamas leader Ismail Haniyeh in Tehran in late July.
Meanwhile, US Defense Secretary Lloyd Austin told his Israeli counterpart Yoav Gallant that he has ordered the USS Abraham Lincoln carrier strike group to accelerate its transit to the Middle East and the USS Georgia guided missile submarine to the Central Command region. This poses the risk of a wider conflict in the key-producing region and lifts the black liquid to climb to over a one-week high on Monday. Furthermore, dovish Federal Reserve (Fed) expectations keep the US Dollar (USD) bulls on the defensive and further contribute to capping the upside for the USD/CAD pair through the early European session.
The markets have fully priced in a 25-basis points (bps) Fed rate cut at the September policy meeting and see the possibility of a bigger, 50-basis points rate cut. This, along with a generally positive tone around the equity markets, continues to weigh on the safe-haven Greenback. The downside for the USD/CAD pair, however, remains cushioned in the wake of Friday's mixed Canadian jobs data, which reaffirmed market bets for another 25-bps rate cut by the Bank of Canada (BoC) in September. Statistics Canada reported that the number of employed people decreased by 2.8K in July, while the Unemployment Rate held steady at 6.4%.
Traders also seem reluctant to place aggressive directional bets and prefer to wait on the sidelines ahead of this week's release of the latest US inflation figures – the Producer Price Index (PPI) and the Consumer Price Index (CPI) on Tuesday and Wednesday, respectively. Nevertheless, the fundamental backdrop warrants some caution before confirming that the USD/CAD pair's recent sharp pullback from the vicinity of mid-1.3900s, or the highest level since October 2022 touched last Monday has run its course.
Technical Outlook
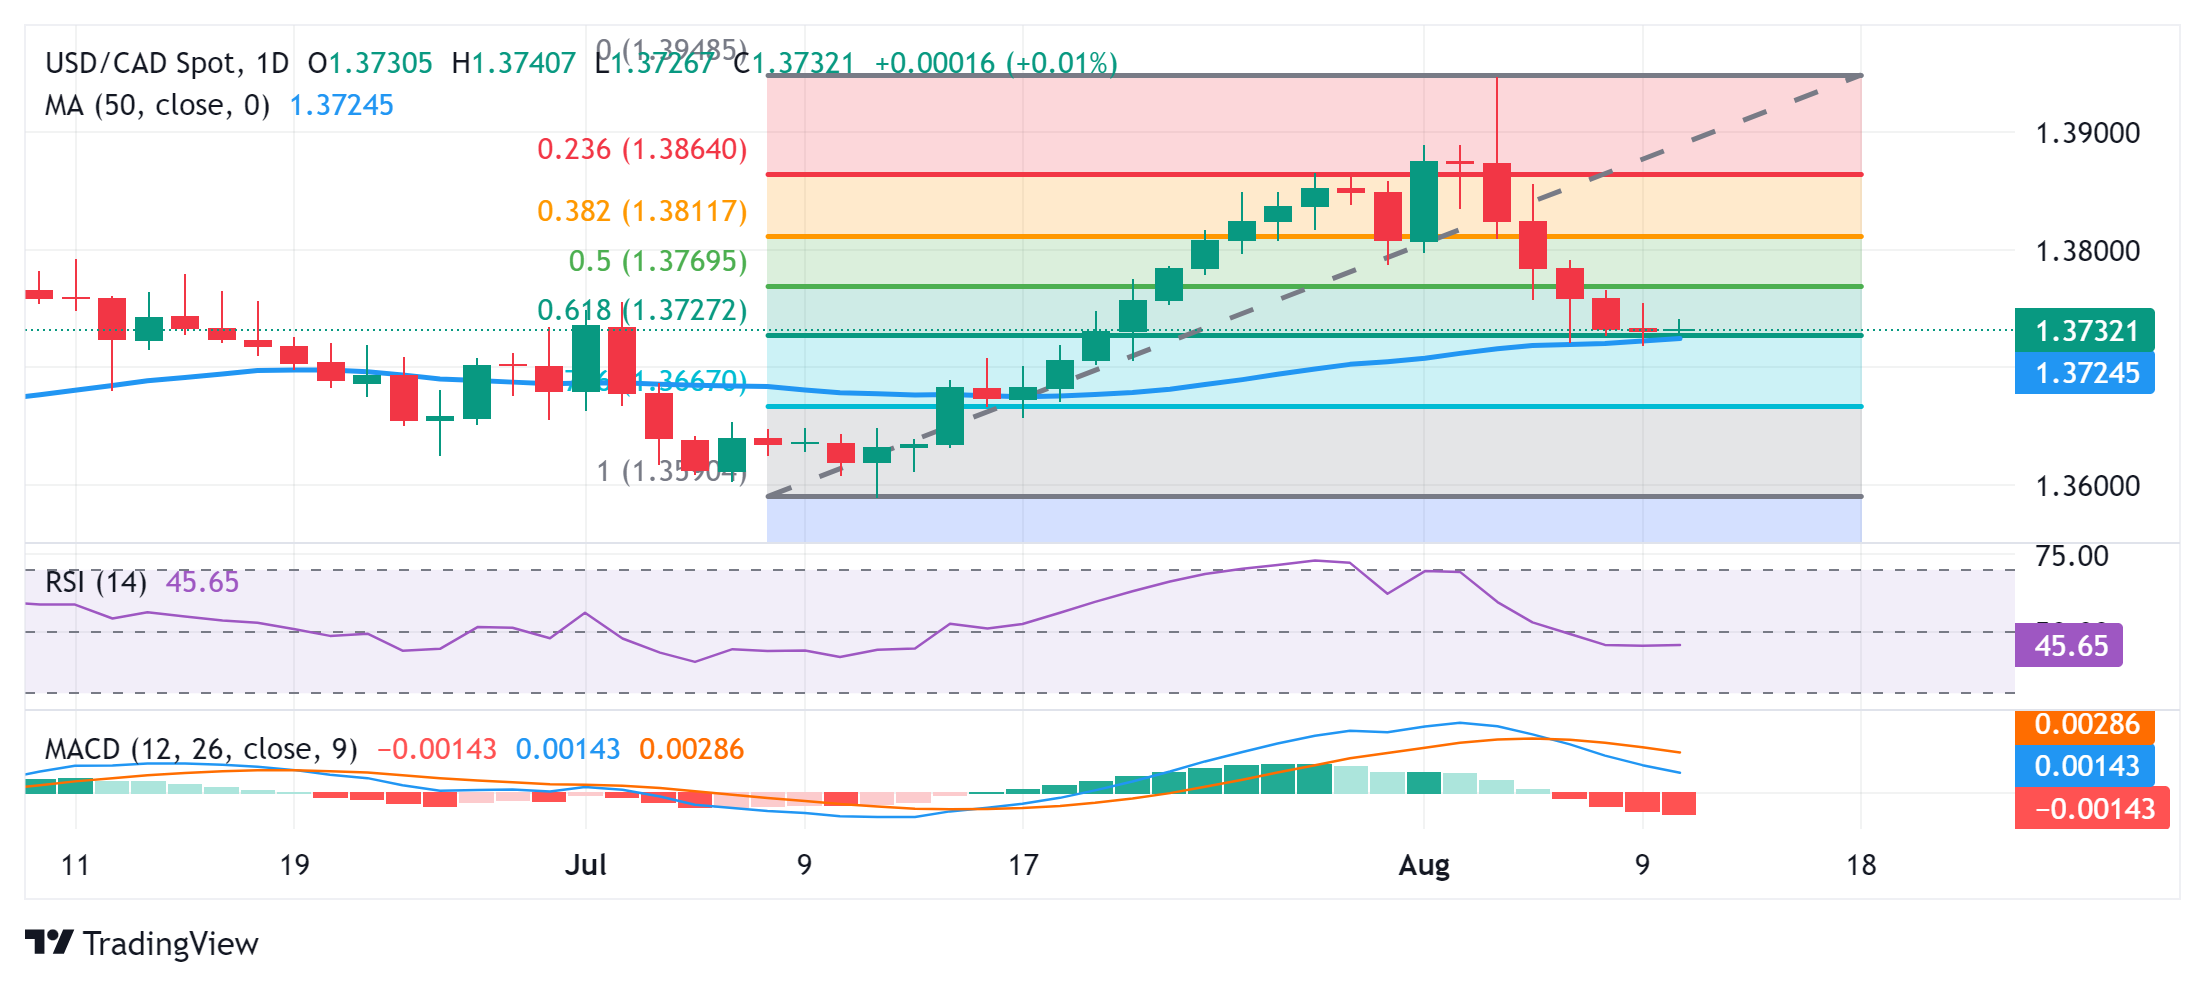
From a technical perspective, the USD/CAD pair, so far, has manages to defend a confluence support near the 1.3720-1.3715 area – comprising the 50-day Simple Moving Average (SMA) and the 61.8% Fibonacci retracement level of the 1.3589-1.3947 rally. Given that oscillators on the daily chart are holding in negative territory, a convincing break below will be seen as a fresh trigger for bearish traders and pave the way for deeper losses. The USD/CAD pair might then accelerate the downfall towards the 78.6% Fibo. level, around the 1.3665 region, before eventually dropping to sub-1.3600 levels, or the July monthly swing low.
On the flip side, any attempted recovery is likely to confront immediate resistance near the 1.3770 area, or the 50% Fibo. level, ahead of the 1.3800 mark. Some follow-through buying might negate the near-term negative bias and lift the USD/CAD pair to the 1.3850 region en route to the 1.3875 intermediate barrier and the 1.3900 round figure. The momentum could extend further and allow bulls to aim back to challenge the YTD peak, around the 1.3945-1.3950 zone.
Author

Haresh Menghani
FXStreet
Haresh Menghani is a detail-oriented professional with 10+ years of extensive experience in analysing the global financial markets.