USD/CAD Forecast

Dollar/CAD extended its falls, taking advantage of the robust Canadian GDP. The first full week of September is packed with events: the BOC decision and the jobs report stand out. Here are the highlights and an updated technical analysis for USD/CAD.
Excellent Canadian GDP gave the Canadian dollar a big boost. This helped it counter the slide in oil prices. The US dollar showed a lot of weakness, mostly suffering from Yellen’s lack of hawkishness in Jackson Hole but then recovered on strong GDP. However, the jUS obs report came out worse than expected.
Updates:
- Sep 4, 0:55: EUR: The Level Of EUR Will Become Increasingly Important Into ECB Sep-7 Meeting – BTMU: EUR/USD made a round trip to 1.2070 before falling back down, well under the 1.20 level. This could influence the...
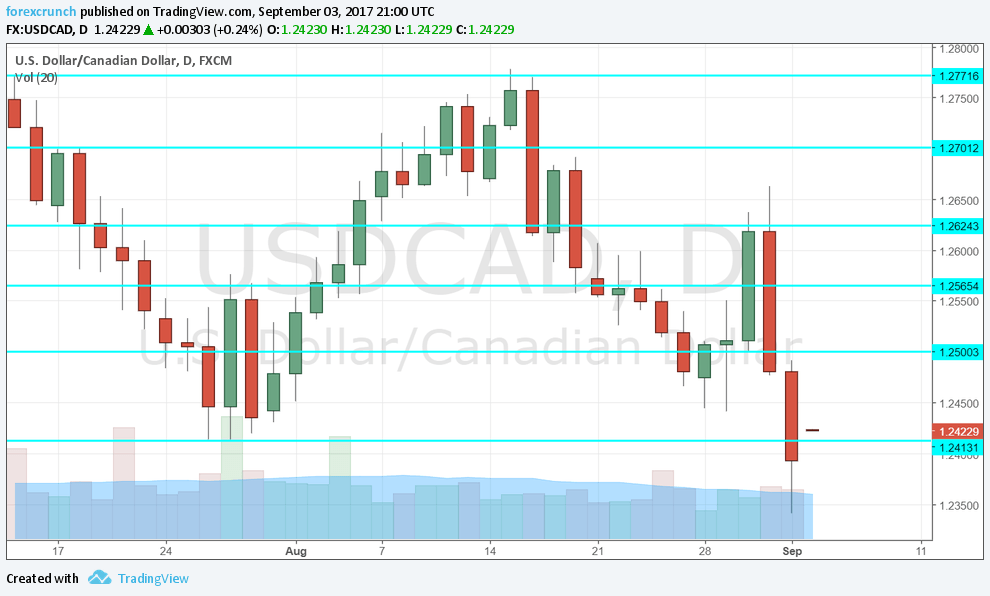
USD/CAD daily graph with support and resistance lines on it.
-
Trade Balance: Wednesday, 12:30. In the past five months, Canada experienced a trade balance deficit. This deficit widened to 3.6 billion in June. Another deficit is likely now and could hurt the US dollar. A deficit of 3.8 billion is expected.
-
Labor Productivity: Wednesday, 12:30. The absence of productivity growth is worrying feature of the global economy. In Canada, labor productivity is volatile. A rise of 1.4% was seen in Q1 2017. We now get the number for Q2. A rise of 0.9% is forecast.
-
BOC decision: Wednesday, 14:00. The Bank of Canada raised rates in July and took another step forward by hinting about another rate hike soon, perhaps in October. Since then, the message has been somewhat softer and the C$ has taken a break. What’s next? This is the big question for this rate decision, as no change in rates is expected.
-
Building Permits: Thursday, 12:30. The housing sector is still alive and kicking with two months of big gains in the number of permits. After 2.5% in June, we could see a slide in July. A rise of 2.2% is predicted.
-
Ivey PMI: Thursday, 14:00. The Richard Ivey Business School has shown robust growth in the past two months. A score of 60 was seen in July. While the figures can be somewhat volatile, the indicator has an impact. A score of 61.3 is on the cards.
-
Capacity Utilization Rate: Friday, 14:00. The Bank of Canada discusses slack in the economy, the level of utilization shows a reduction of slack, which could lead to a rise in inflation. 83.3% was seen in Q1 2017. We now get the data for Q2.
USD/CAD Technical Analysis
Dollar/CAD continued pushing lower below the 1.25 level (discussed last week).
Technical lines from top to bottom:
1.30 is towering above. It is followed by 1.2940 which capped the pair in July.
1.2860 was a relatively significant stepping stone on the way down, holding the pair for some time. It is followed by 1.2775, which marked a recovery attempt.
1.27 is a round number and also the top of a short-lived range. 1.2640 was the bottom of that range and a level where the pair reached after bouncing back.
1.2580 is a pivotal line and capped the pair temporarily on its recovery path. 1.25, a very round number, provided support for the pair in August.
1.2410 is a very strong line, serving as the low for 2017 (so far). Further down, we find levels last seen in early 2015. These levels are 1.22 and 1.20.
I turn bearish on USD/CAD
The Canadian dollar seems to have ended its phase of correction and is ready to continue rising. The Canadian economy is outperforming the American one, and this should push USD/CAD lower.
Author

Kenny Fisher
MarketPulse
A highly experienced financial market analyst with a focus on fundamental analysis, Kenneth Fisher’s daily commentary covers a broad range of markets including forex, equities and commodities.


