USD/CAD Forecast

The Canadian dollar rally continued last week, as USD/CAD dropped 250 points. The pair closed at 1.2633, its lowest weekly close since April 2016. This week’s key events are CPI and Core Retail Sales. Here is an outlook on the major market-movers and an updated technical analysis for USD/CAD.
The Canadian dollar sparkled last week, buoyed by a rate hike from the Bank of Canada. The BoC raised rates from 0.50% to 0.75%. This was the first rate hike since July 2015. In the US, the latest political scandal involving Donald Trump Jr. hurt the dollar, and Yellen’s concern about low inflation also weighed on the greenback.
Updates:
- Jul 17, 8:14: Has the Canadian dollar gone too far? Two opinions: The Canadian dollar enjoyed the hawkish hike as well as strong data in Canada in weak figures in the US....
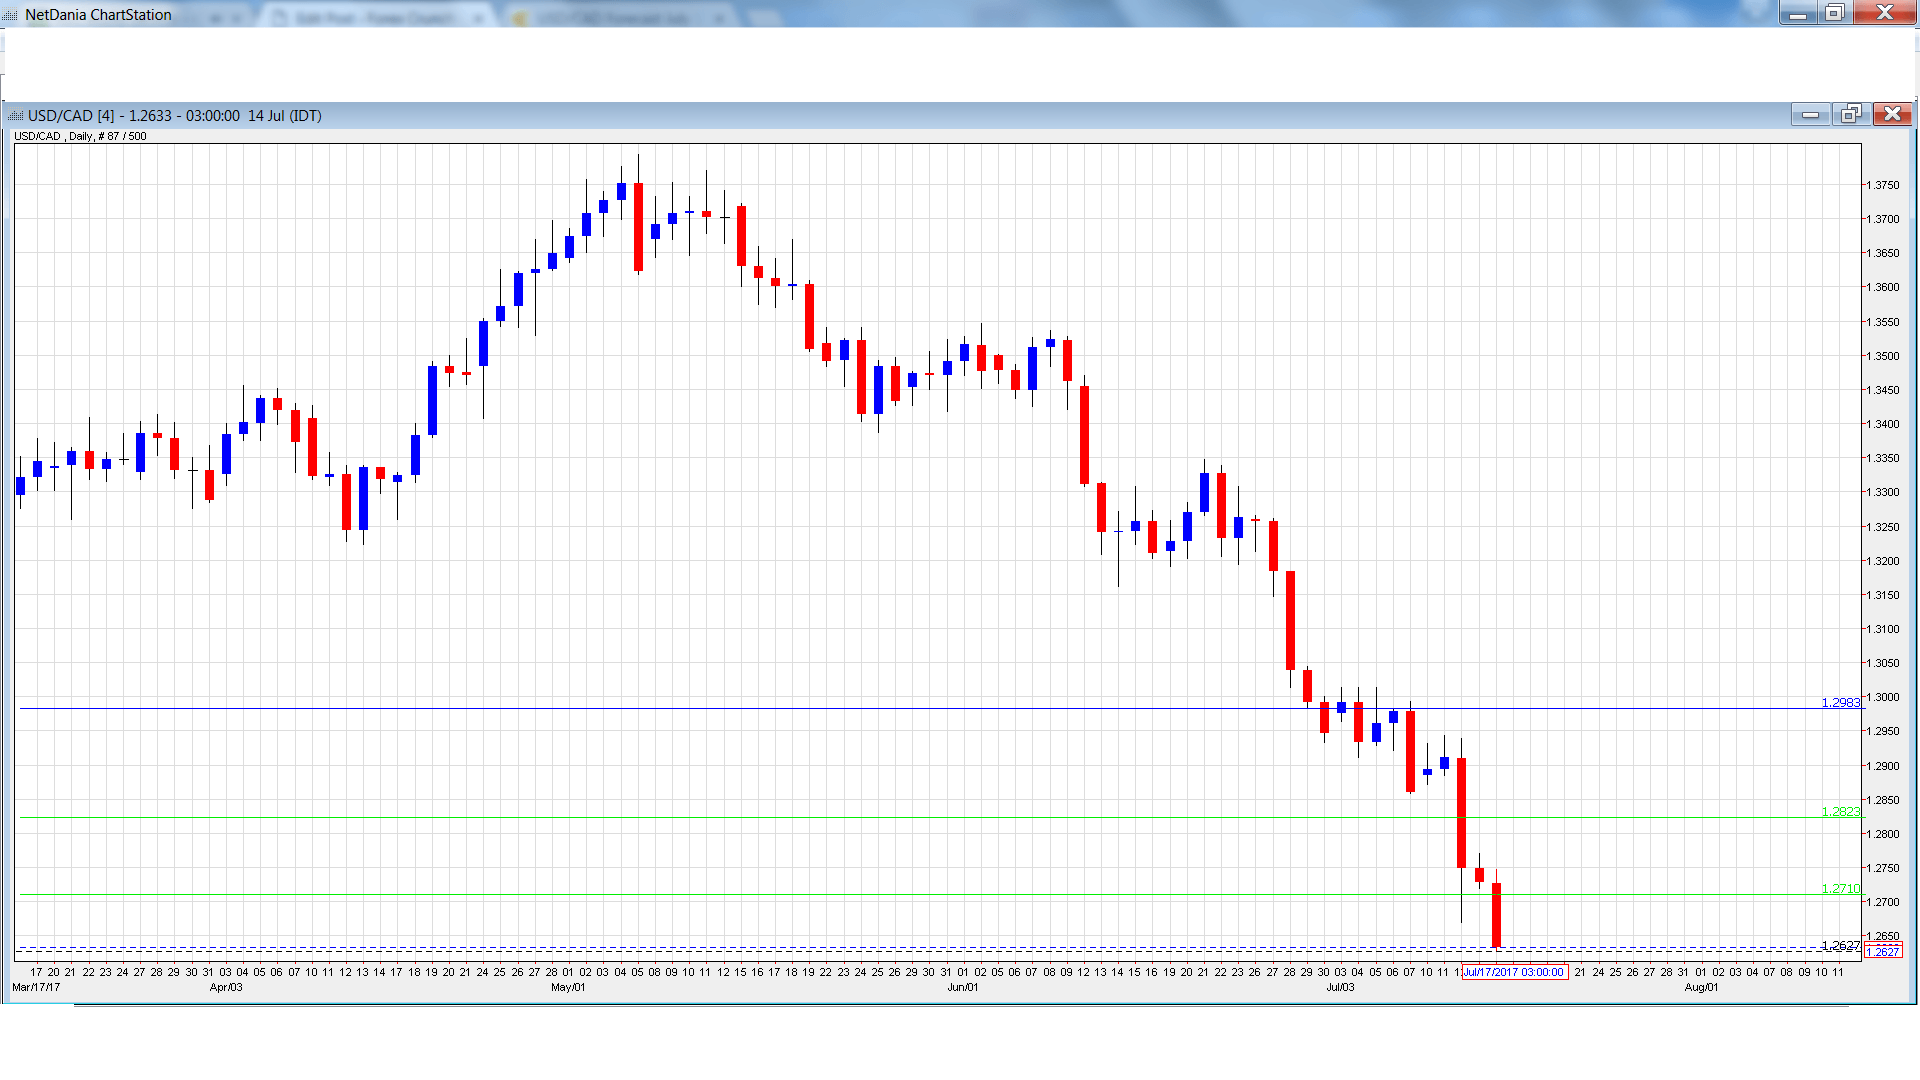
USD/CAD daily graph with support and resistance lines on it.
-
Foreign Securities Purchases: Monday, 8:30. The indicator softened to GBP 10.60 billion in April, short of the forecast of GBP 12.14 billion. The downward trend is expected to continue in May, with an estimate of GBP 9.78 billion.
-
Manufacturing Sales: Wednesday, 8:30. The indicator improved to 1.1% in April, beating the forecast of 0.9%. The estimate for May stands at 0.8%.
-
CPI: Friday, 8:30. CPI softened to 0.1% in May, short of the estimate of 0.2%. This was the lowest level in 5 months. The downward trend is expected to continue in June, with an estimate of a flat 0.0%.
-
Core Retail Sales: Friday, 8:30. Core Retail Sales jumped 1.5% in April, crushing the estimate of 0.6%. This marked a 3-month high. The markets are expecting a much smaller gain in May, with the estimate standing at 0.4%.
-
Retail Sales: Friday, 8:30. The indicator improved to 0.8% in April, easily beating the estimate of 0.3%. The indicator is expected to weaken in May, with a forecast of 0.5%.
USD/CAD Technical Analysis
USD/CAD opened the week at 1.2885 and climbed to a high of 1.2943, as 1.2983 held in resistance.The pair then reversed directions and dropped to a low of 1.2627. USD/CAD closed the week at 1.2633.
Technical lines, from top to bottom
With USD/CAD posting sharp losses last week, we start at lower levels:
1.2980 held firm in resistance last week.
1.2823 is the next resistance line.
1.2710 has switched to resistance. It is an immediate line.
1.2563 has provided support since May 2016.
1.2457 is next.
1.2351 has been a cushion since May 2015.
1.2218 is the final support level for now.
I am bearish on USD/CAD
The Canadian economy continues to add jobs at an impressive rate and last week’s rate hike has made the Canadian dollar more attractive to investors. In the US, allegations of Trump’s connections with Russia continue to swirl, and the markets are skeptical about a rate hike before the end of the year.
Interested in USDCAD technicals? Check out the key levels
Author

Kenny Fisher
MarketPulse
A highly experienced financial market analyst with a focus on fundamental analysis, Kenneth Fisher’s daily commentary covers a broad range of markets including forex, equities and commodities.


