USD/CAD Elliott Wave technical analysis [Video]
![USD/CAD Elliott Wave technical analysis [Video]](https://editorial.fxstreet.com/images/Markets/Currencies/Majors/USDCAD/canadian-money-2706551_XtraLarge.jpg)
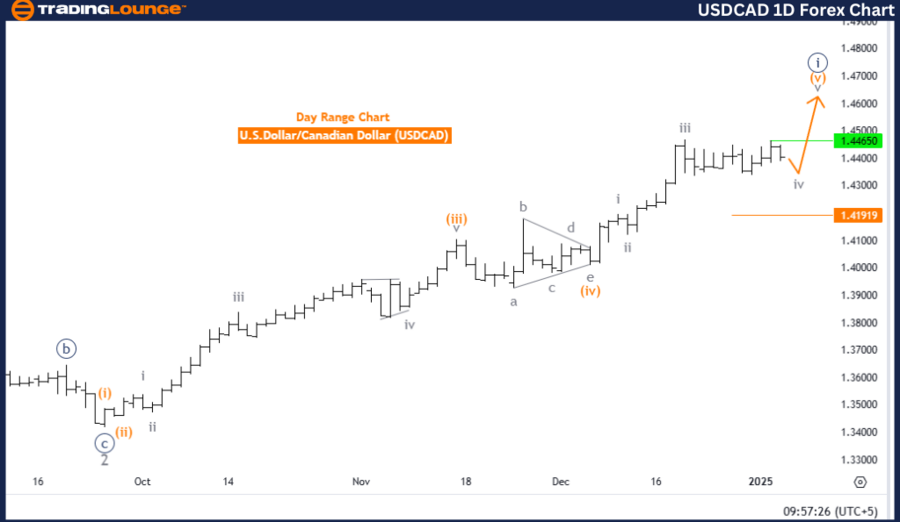
USD/CAD Elliott Wave technical analysis
-
Function: Trend.
-
Mode: Impulsive.
-
Structure: Orange Wave 5.
-
Position: Navy Blue Wave 1.
-
Direction next lower degrees: Navy Blue Wave 2.
Details
-
Current Status: Orange wave 4 appears to be complete, with orange wave 5 of navy blue wave 1 now in progress.
-
Invalidation Level: 1.41919.
Analysis summary
The USDCAD daily chart analysis presents an impulsive trend structure based on Elliott Wave principles. It focuses on orange wave 5, which is part of the broader navy blue wave 1 sequence. This indicates sustained upward momentum after completing orange wave 4, the corrective phase.
Current progression
- Orange wave 4 has concluded, marking the transition to orange wave 5, which represents the final impulsive wave within navy blue wave 1.
- This phase showcases a strong bullish trend, aiming to complete the cycle.
Larger trend context
- The broader position aligns with navy blue wave 1, the initial wave of a larger impulsive sequence.
- Upon completing orange wave 5, the focus will shift to navy blue wave 2, introducing a corrective phase before the broader bullish trend resumes.
Invalidation level
- The wave count’s invalidation threshold is set at 1.41919.
- Price movement above this level invalidates the current analysis, requiring a reevaluation of the wave structure.
- This level is critical to maintaining the integrity of the Elliott Wave count and confirming ongoing trend dynamics.
Conclusion
The USD/CAD daily chart exhibits a bullish impulsive trend with orange wave 5 of navy blue wave 1 currently in progress. The recent completion of orange wave 4 establishes the groundwork for continued upward momentum. Attention is drawn to the invalidation level of 1.41919, which ensures adherence to the Elliott Wave framework and confirms the analysis.
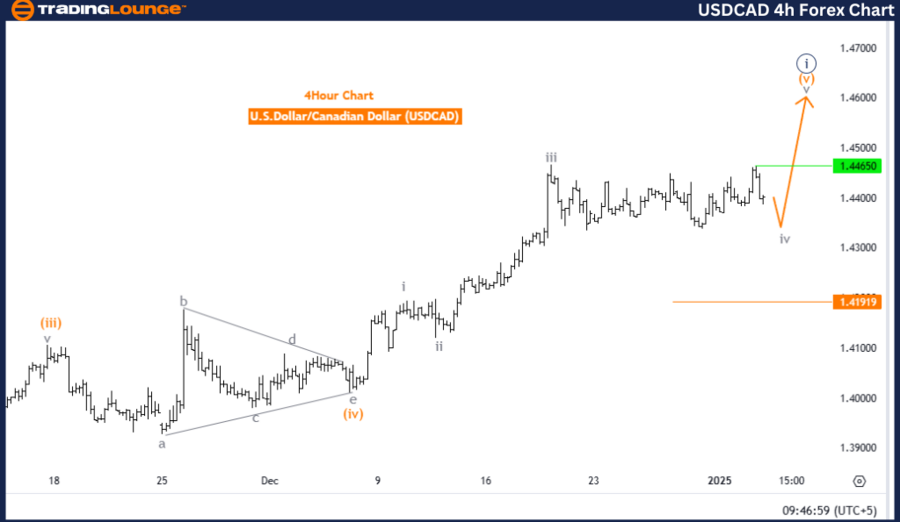
USD/CAD Elliott Wave technical analysis
-
Function: Counter-Trend.
-
Mode: Corrective.
-
Structure: Gray Wave 4.
-
Position: Orange Wave 5.
-
Direction next higher degrees: Gray Wave 5.
Details
- Current Status: Gray wave 3 appears complete, with gray wave 4 now actively developing.
- Invalidation Level: 1.41919
Analysis summary
The USDCAD four-hour chart analysis indicates a counter-trend phase within a corrective wave structure, as defined by Elliott Wave principles. The focus is on gray wave 4, which forms part of the broader gray wave 5 sequence. This phase suggests a temporary consolidation or retracement within the larger impulsive wave trend.
Current progression
- The preceding gray wave 3 has concluded, marking the end of a significant impulsive phase.
- Gray wave 4 is now unfolding as a corrective phase, which often precedes the resumption of the next impulsive wave.
Larger trend context
- The direction at the next higher degree points toward gray wave 5, indicating potential bullish momentum once gray wave 4 completes.
- This stage represents a pause within the current trend, laying the groundwork for the subsequent impulsive wave in the sequence.
Invalidation level
- The wave count’s invalidation threshold is set at 1.41919.
- Price movements exceeding this level would invalidate the current analysis and necessitate a reassessment of the wave structure.
- This threshold is critical for confirming the corrective wave count and ensuring the Elliott Wave framework's integrity.
Conclusion
The USDCAD 4-hour chart depicts a corrective counter-trend phase with gray wave 4 actively forming after gray wave 3 has completed. As part of the larger gray wave 5 structure, this corrective stage sets the stage for the continuation of the broader trend. Emphasis is placed on monitoring the invalidation level at 1.41919, which ensures the wave count’s accuracy and confirms adherence to the Elliott Wave principles.
USD/CAD Elliott Wave technical analysis [Video]
Author

Peter Mathers
TradingLounge
Peter Mathers started actively trading in 1982. He began his career at Hoei and Shoin, a Japanese futures trading company.


