USD/CAD Elliott Wave technical analysis [Video]
![USD/CAD Elliott Wave technical analysis [Video]](https://editorial.fxstreet.com/images/Markets/Currencies/Majors/USDCAD/five-dollar-bills-9087891_XtraLarge.jpg)
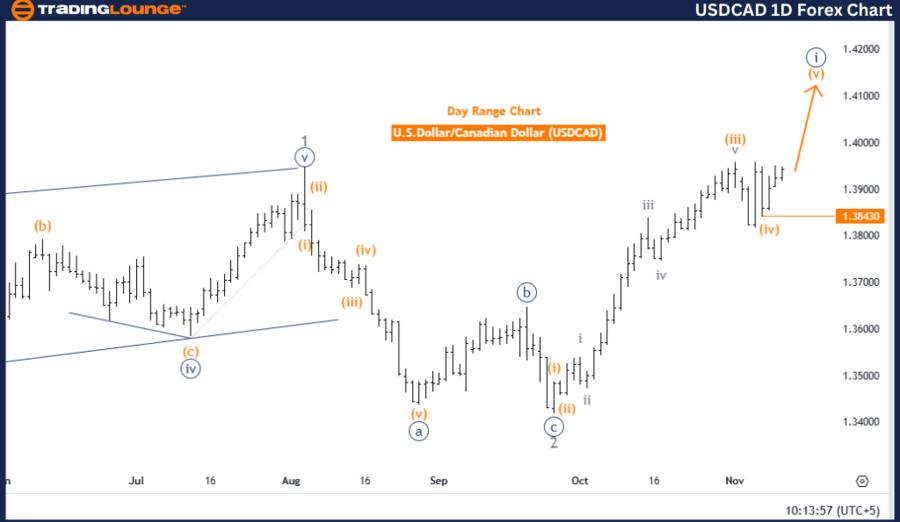
U.S. Dollar / Canadian Dollar (USDCAD) Day Chart.
USD/CAD Elliott Wave technical analysis
-
Function: Trend
-
Mode: Impulsive
-
Structure: Navy blue wave 1
-
Position: Gray wave 3
-
Direction next lower degrees: Navy blue wave 2
-
Details: Orange wave 4 of navy blue wave 1 appears completed; now orange wave 5 of navy blue wave 1 is in play.
-
Wave cancel invalidation level: 1.38430
The USDCAD Elliott Wave analysis on the daily chart from Trading Lounge evaluates the technical trend structure for the U.S. Dollar and Canadian Dollar pair. The analysis identifies an ongoing impulsive wave pattern, which is moving in an upward trajectory and structured as navy blue wave 1.
Within this broader wave sequence:
-
Gray wave 3 remains active.
-
Orange wave 4, part of the navy blue wave 1 sequence, is likely completed.
-
This sets the stage for orange wave 5 to develop within the navy blue wave 1 structure, signaling the continuation of the upward trend.
The current analysis suggests that the trend may persist in its bullish direction, given the anticipated continuation of orange wave 5 within this wave framework. Traders and analysts are advised to closely monitor the progression of wave formations. The successful completion of orange wave 5 would support the broader upward movement indicated in navy blue wave 1.
Key marker – Invalidation level
An invalidation level has been set at 1.38430. If USDCAD prices drop to this level or lower, it would signal a breakdown in the current wave pattern. Such a scenario could indicate a shift in market direction or structure, necessitating a reassessment of the analysis. This invalidation level acts as a critical benchmark, enabling traders to verify the validity of the current impulsive structure and adjust their outlook if needed.
Summary
The USDCAD daily chart points to a sustained bullish outlook, with caution advised near the invalidation level of 1.38430. While the pattern suggests continued upward momentum, traders should remain vigilant for potential reversals should the price approach or fall below this threshold.
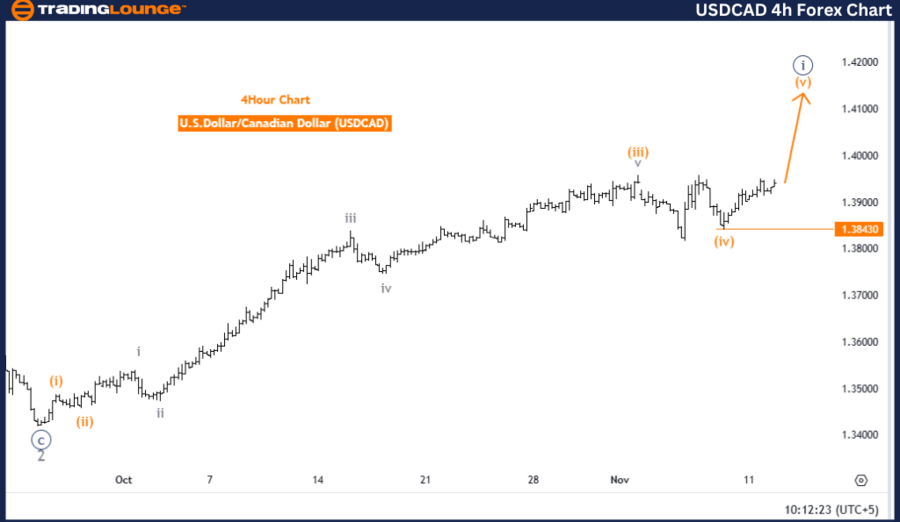
U.S. Dollar / Canadian Dollar (USDCAD) 4 Hour Chart
USD/CAD Elliott Wave technical analysis
-
Function: Trend.
-
Mode: Impulsive.
-
Structure: Orange wave 5.
-
Position: Navy blue wave 1.
-
Direction next lower degrees: Navy blue wave 2.
-
Details: Orange wave 4 appears completed; orange wave 5 of navy blue wave 1 is now in play.
-
Wave cancel invalidation level: 1.38430.
The USDCAD Elliott Wave analysis on the 4-hour chart from Trading Lounge provides an in-depth review of the technical trend structure for the U.S. Dollar and Canadian Dollar pair. This analysis identifies an ongoing impulsive wave pattern, with a focus on orange wave 5, part of the broader navy blue wave 1 structure.
- The apparent completion of orange wave 4 indicates the beginning of the final phase, orange wave 5, which would continue the upward trajectory within this impulsive framework.
- The position of orange wave 5 within navy blue wave 1 underscores the primary upward trend, with the potential for further bullish momentum as this wave develops.
Key marker – Invalidation level
An invalidation level has been identified at 1.38430. If prices decline to or below this level, it would signal a breakdown in the anticipated wave structure. Such a scenario would imply a disruption in the progression of orange wave 5 and navy blue wave 1, suggesting the possibility of a trend reversal or a need to re-evaluate the wave structure.
Summary
The analysis anticipates the continuation of bullish momentum as orange wave 5 unfolds within the larger navy blue wave 1. Traders should monitor the development of orange wave 5 closely, as its completion could confirm the integrity of the current upward trend. However, vigilance is necessary around the invalidation level of 1.38430, as reaching this threshold could indicate a reversal or restructuring of the wave pattern. This level acts as a strategic reference point for trend validation.
USD/CAD Elliott Wave technical analysis [Video]
Author

Peter Mathers
TradingLounge
Peter Mathers started actively trading in 1982. He began his career at Hoei and Shoin, a Japanese futures trading company.


