USD/CAD Elliott Wave technical analysis [Video]
![USD/CAD Elliott Wave technical analysis [Video]](https://editorial.fxstreet.com/images/Markets/Currencies/Majors/USDCAD/canadian-money-2670959_XtraLarge.jpg)
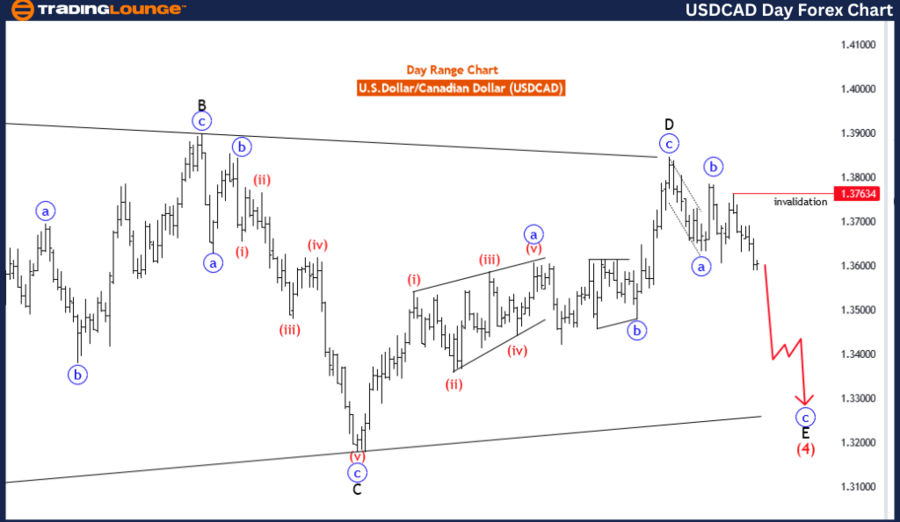
USD/CAD Elliott Wave Analysis Trading Lounge Day Chart.
U.S.Dollar /Canadian Dollar (USD/CAD) Day Chart
USD/CAD Elliott Wave technical analysis
Function: Counter Trend.
Mode: Corrective.
Structure: Blue wave C..
Position: Black wave E of triangle..
Direction next higher degrees: Red wave 5.
Details: blue wave B of E completed, now blue wave C is in play.
Wave cancel invalid level: 1.37634.
Function: The analysis of the USD/CAD on the daily chart identifies the current movement as a "Counter Trend." This indicates that the waves being studied are acting against the primary trend, suggesting a corrective phase.
Mode: The mode of the current market activity is "Corrective." In Elliott Wave theory, corrective waves move against the prevailing trend and typically consist of three sub-waves (A, B, and C), indicating a temporary pause or reversal before the trend resumes.
Structure: The structure under examination is "blue wave C." This wave is part of a larger corrective pattern and usually completes the correction phase, leading to the resumption of the primary trend.
Position: The position of the market is identified as "black wave E of triangle." In Elliott Wave terms, a triangle is a corrective pattern made up of five waves (A, B, C, D, and E). The current position suggests the market is in the final wave (E) of this triangle, indicating the end of the correction is near.
Direction for next higher degrees: The analysis points to "red wave 5" as the direction for the next higher degrees. This implies that after the completion of the current corrective wave (blue wave C), the market is expected to resume the larger trend with a strong impulsive move (red wave 5).
Details: Wave Completion: The analysis notes that "blue wave B of E" has completed. This completion signifies the end of a sub-wave within the larger triangle pattern, setting the stage for the final wave.
Current wave in play: The market is now experiencing "blue wave C," which is the final wave in the corrective triangle pattern.
Invalidation level: The wave cancellation or invalidation level is set at 1.37634. If the market exceeds this level, the current wave count will be invalidated, indicating a possible change in the wave structure.
Summary
The USD/CAD Elliott Wave analysis on the daily chart suggests the pair is in a counter-trend corrective phase, specifically within a triangle pattern. After completing "blue wave B of E," the market has entered "blue wave C," indicating the final stage of the correction. Traders should watch the invalidation level at 1.37634, as surpassing this level would negate the current wave count and signal a potential shift in market dynamics. Following the completion of "blue wave C," the analysis anticipates the resumption of the primary trend with the onset of "red wave 5." This detailed wave structure provides crucial insights for anticipating market movements and potential reversal points.
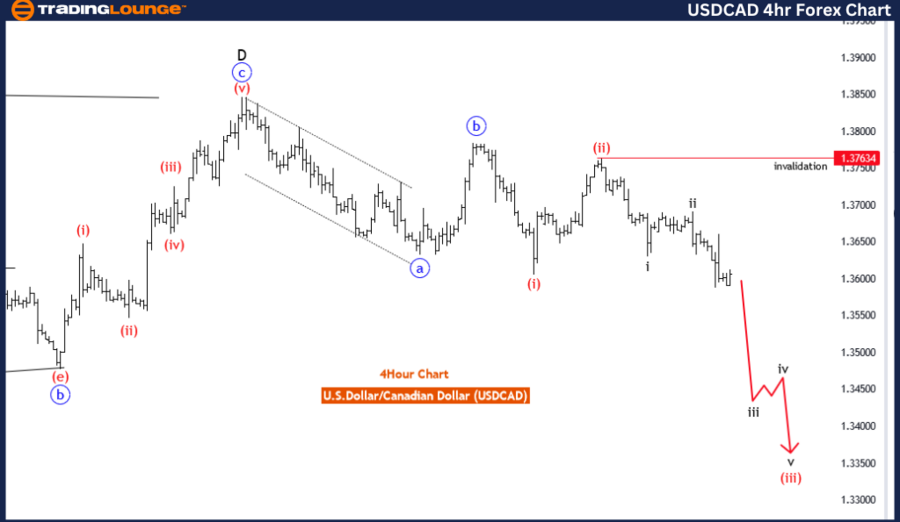
USD/CAD Elliott Wave technical analysis four-hour chart
Function: Counter Trend.
Mode: Impulsive.
Structure: Red wave 3.
Position: Blue wave C.
Direction next higher degrees: Red wave 4.
Details: Red wave 2 of C completed at 1.37634, now red wave 3 is in play.
Wave cancel invalid level: 1.37634.
Function: The primary function identified for the USD/CAD pair on the 4-hour chart is "Counter Trend." This indicates that the current wave movements are acting against the prevailing larger trend, suggesting a potential short-term reversal or correction.
Mode: The mode of the current market movement is "impulsive." In Elliott Wave theory, impulsive waves move strongly in the direction of the trend and consist of five sub-waves. This suggests robust and decisive market action in the counter-trend direction.
Structure: The structure currently being analyzed is "red wave 3." This wave is typically the most powerful and extended wave within an impulsive sequence, indicating significant price movement in the direction of the counter-trend.
Position: The specific position within the wave sequence is identified as "blue wave C." This placement indicates that the market is within the C wave of a corrective pattern, often characterized by strong movements as it completes the correction phase.
Direction for next higher degrees: The analysis points to the next higher degrees as "red wave 4." This implies that after the completion of the current impulsive wave (red wave 3), the market is expected to enter a corrective phase, pulling back before potentially resuming the larger trend.
Details: Wave Completion: The analysis notes that "red wave 2 of C" has completed at the level of 1.37634. This completion marks the end of a corrective wave and sets the stage for the beginning of the impulsive wave.
Current wave in play: The market is now experiencing "red wave 3," indicating strong price movement in the counter-trend direction.
Invalidation Level: The wave cancellation or invalidation level is set at 1.37634. If the market falls below this level, the current wave count will be invalidated, signaling a potential change in the market structure.
Summary
The USD/CAD Elliott Wave analysis on the 4-hour chart suggests that the pair is currently experiencing a counter-trend movement. After completing "red wave 2 of C" at 1.37634, the market has entered "red wave 3," characterized by strong, impulsive movements. Traders should note the invalidation level at 1.37634, as a breach of this level would negate the current wave count and indicate a potential shift in market dynamics. This analysis is crucial for understanding short-term corrective actions within the broader market trend for the USD/CAD pair.
USD/CAD Elliott Wave technical analysis [Video]
Author

Peter Mathers
TradingLounge
Peter Mathers started actively trading in 1982. He began his career at Hoei and Shoin, a Japanese futures trading company.


