|

USD/CAD Elliott Wave: Fourth wave in place

Executive summary

  • Wave ((iv)) completion: Wave ((iv)) wrapped up on Friday at 1.3924 leading to wave ((v)) lower.
  • 5th wave: Wave ((v)) would be the ending wave of the larger downtrend pattern that began February 3.
  • Downside target: Next trend appears lower in wave ((v)) possibly reaching 1.3426.

Current Elliott Wave analysis

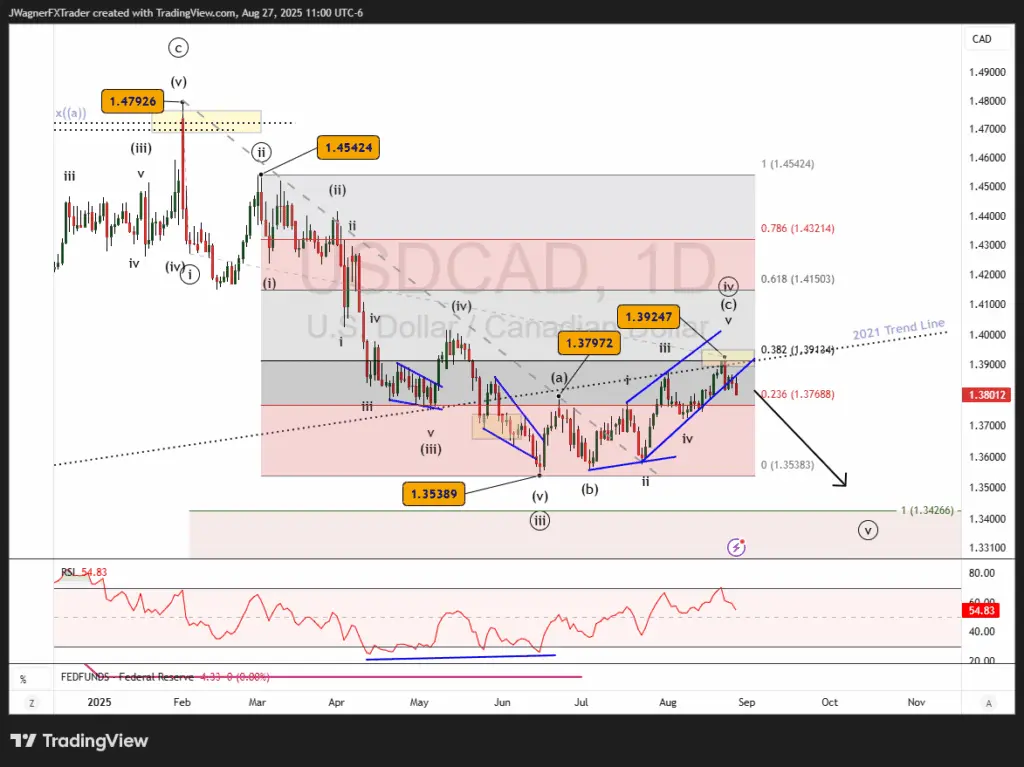
Back on June 19, 3 days after wave ((iii)) finished, we forecasted a rally to 1.3914 in wave ((iv)).

The rally trended to 1.3924 last Friday, August 22, then reversed.

The reversal highlights the end of wave ((iv)) and wave ((v)) is in the early stages of a downtrend trend.

Wave ((iv)) appears to have carved an (a)-(b)-(c) flat pattern where wave (c) was an ending diagonal pattern, a rising wedge type of pattern. 

There were a lot of wave relationships appearing near 1.3914. First, the 38.2% Fibonacci retracement level sits there. Second, a broken trend line from 2021 passes through the price zone.

With USDCAD now breaking below the support trend line of the ending diagonal pattern, we can confidently suggest that the top is in place for wave ((iv)).

This implies an Elliott wave 5th wave lower that likely targets 1.3426. Using the Fibonacci extension tool, wave ((v)) would be 100% to wave ((i)) near 1.3426. Also, there is a September 2024 swing low near there at 1.3419 (not shown).

Bottom line

USD/CAD finalized wave ((iv)) on Friday and is declining in wave ((v)). We anticipate wave ((v)) to reach near 1.3426. If 1.3924 is broken to the upside, then we’ll consider other alternate wave counts.

Author

Zorrays Junaid

Zorrays Junaid

Alchemy Markets

Zorrays Junaid has extensive combined experience in the financial markets as a portfolio manager and trading coach. More recently, he is an Analyst with Alchemy Markets, and has contributed to DailyFX and Elliott Wave Forecast in the past.

More from Zorrays Junaid
Share:

Editor's Picks

EUR/USD treads water around 1.1900

EUR/USD edges a tad lower around the 1.1900 area, coming under mild pressure despite the US Dollar keeps the offered stance on turnaround Tuesday. On the US data front, December Retail Sales fell short of expectations, while the ADP four week average printed at 6.5K.

GBP/USD looks weak near 1.3670

GBP/USD trades on the back foot around the 1.3670 region on Tuesday. Cable’s modest retracement also comes in tandem with the decent decline in the Greenback. Moving forward, the US NFP and CPI data in combination with key UK releases should kee the quid under scrutiny in the next few days.

Gold the battle of wills continues with bulls not ready to give up

Gold comes under marked selling pressure on Tuesday, giving back part of its recent two day advance and threatening to challenge the key $5,000 mark per troy ounce. The yellow metal’s correction follows a better tone in the risk complex, a lower Greenback and shrinking US Treasuty yields.

AI Crypto Update: BankrCoin, Pippin surge as sector market cap steadies above $12B

The Artificial Intelligence (AI) segment is largely on the back foot with major coins such as Bittensor (TAO) and Internet Computer (ICP) extending losses amid a sticky risk-off sentiment.

Dollar drops and stocks rally: The week of reckoning for US economic data

Following a sizeable move lower in US technology Stocks last week, we have witnessed a meaningful recovery unfold. The USD Index is in a concerning position; the monthly price continues to hold the south channel support.

XRP holds $1.40 amid ETF inflows and stable derivatives market

Ripple trades under pressure, with immediate support at $1.40 holding at the time of writing on Tuesday. A recovery attempt from last week’s sell-off to $1.12 stalled at $1.54 on Friday, leading to limited price action between the current support and the resistance.