USD and the bonds were pointed higher
USD: Jun '24 is Up at 105.430.
Energies: Jun '24 Crude is Down at 77.37.
Financials: The June '24 30 Year T-Bond is Down 10 ticks and trading at 116.12.
Indices: The Jun '24 S&P 500 emini ES contract is 36 ticks Lower and trading at 5204.75.
Gold: The Jun'24 Gold contract is trading Up at 2324.50
Initial conclusion
This is not a correlated market. The USD is Up and Crude is Down which is normal, but the 30 Year T-Bond is trading Lower. The Financials should always correlate with the US dollar such that if the dollar is Higher, then the bonds should follow and vice-versa. The S&P is Lower and Crude is trading Lower which is not correlated. Gold is trading Higher which is not correlated with the US dollar trading Up. I tend to believe that Gold has an inverse relationship with the US Dollar as when the US Dollar is down, Gold tends to rise in value and vice-versa. Think of it as a seesaw, when one is up the other should be down. I point this out to you to make you aware that when we don't have a correlated market, it means something is wrong. As traders you need to be aware of this and proceed with your eyes wide open. All of Asia is trading Lower. Currently all of Europe is trading Higher except the Milan exchange which is Lower.
Possible challenges to traders
-
Final Wholesale Inventories m/m is out at 10 AM EST. This is Major.
-
Crude Oil Inventories is out at 10:30 AM EST. This is Major.
-
FOMC Member Jefferson Speaks at 11 AM EST. This is Major.
-
10-y Bond Auction starts at 1 PM EST. This is Major.
-
FOMC Member Cook Speaks at 1:30 PM EST. This is Major.
Treasuries
Traders, please note that we've changed the Bond instrument from the 30 year (ZB) to the 10 year (ZN). They work exactly the same.
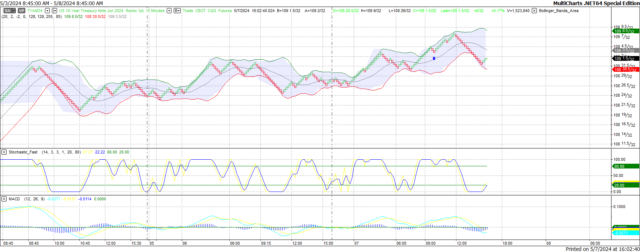
We've elected to switch gears a bit and show correlation between the 10-year bond (ZN) and the S&P futures contract. The S&P contract is the Standard and Poor's, and the purpose is to show reverse correlation between the two instruments. Remember it's likened to a seesaw, when up goes up the other should go down and vice versa.
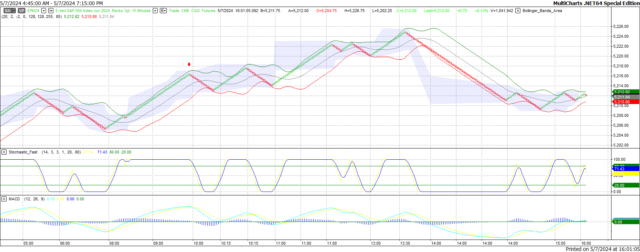
Yesterday the ZN migrated Higher at around 9:30 AM EST as the S&P hit a High at around that time and the ZN moved Higher. If you look at the charts below the ZN gave a signal at around 9:30 AM and started its Upward climb. Look at the charts below and you'll see a pattern for both assets. S&P moving Lower at around 9:30 AM and the ZN moving Higher at around the same time. These charts represent the newest version of MultiCharts and I've changed the timeframe to a 15-minute chart to display better. This represented a Long opportunity on the 10-year note, as a trader you could have netted about 10 ticks per contract on this trade. Each tick is worth $15.625. Please note: the front month for both the ZN and the S&P are now Jun '24. I've changed the format to filled Candlesticks (not hollow) such that it may be more apparent and visible.
Charts courtesy of MultiCharts built on an AMP platform
ZN -Jun 2024 - 05/07/24
S&P - Jun 2024 - 05/07/24
Bias
Yesterday we suggested a Neutral or Mixed bias as we saw no evidence of Market Correlation. The markets didn't disappoint as the Dow closed Higher by 32 points and the S&P by 7 but the Nasdaq closed Lower by 17 points. Today we aren't dealing with a correlated market and our bias is to the Downside.
Could this change? Of Course. Remember anything can happen in a volatile market.
Commentary
Yesterday when we first viewed the markets, we saw some things that we didn't like. Both the USD and the Bonds were pointed Higher, and this should reflect a Down Day except the indices themselves weren't pointed Lower. An immediate red flag and hence the Neutral or Mixed bias. The markets gave us exactly that as the Dow and S&P closed minimally Higher, but the Nasdaq closed Lower, thus the Mixed day. The Dow did show a gain for the fifth day in a row, and some may consider that as a rally, but it isn't. All the indices must point Higher. Today we have crude oil inventories out at 10:30 AM as well as the Ten-Year Bond Auction at 1 PM EST. It is hoped that we get some solid direction, one way or another.
Author

Nick Mastrandrea
Market Tea Leaves


