US October Nonfarm Payrolls Preview: Analyzing Gold price's reaction to NFP surprises
- Nonfarm Payrolls in the US are forecast to increase by 180,000 in October.
- Gold is likely to react slightly stronger to a disappointing jobs report than an upbeat one.
- Gold price's inverse-correlation with NFP surprise weakens slightly by the fourth hour after the release.

Historically, how impactful has the US jobs report been on gold’s valuation? In this article, we present results from a study in which we analyzed the XAU/USD pair's reaction to the previous 35 NFP prints*.
We present our findings as the US Bureau of Labor Statistics (BLS) gets ready to release the October jobs report on Friday, November 3. Expectations are for a 180,000 rise in Nonfarm Payrolls following the stronger-than-expected 336,000 increase recorded in September.
*We omitted the NFP data for March 2021 and March 2023, which were published on the first Friday of April, due to lack of volatility amid Easter Friday.
Methodology
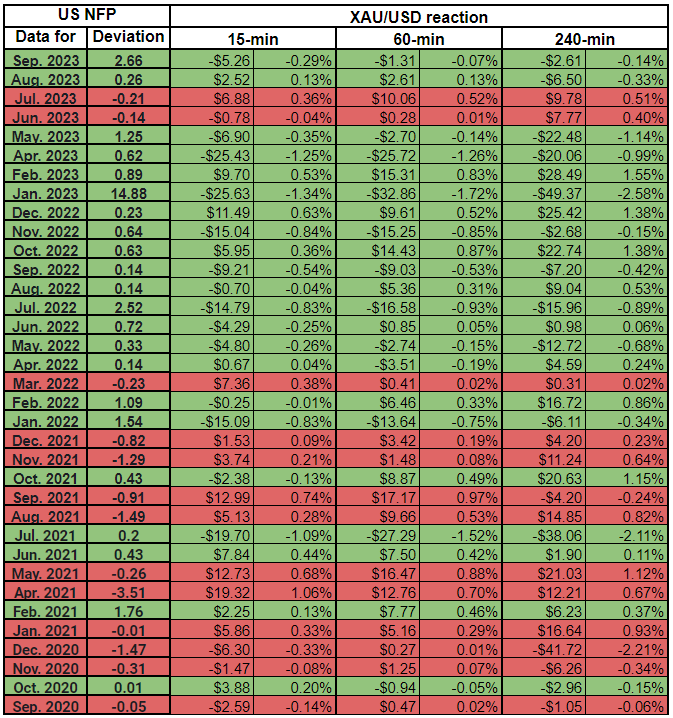
We plotted gold price’s reaction to the NFP print at 15 minutes, one hour and four hours intervals after the release. Then, we compared the gold price reaction to the deviation between the actual NFP release result and the expected result.
We used the FXStreet Economic Calendar for data on deviation as it assigns a deviation point to each macroeconomic data release to show how big the divergence was between the actual print and the market consensus. For instance, the August (2021) NFP data missed the market expectation of 750,000 by a wide margin and the deviation was -1.49. On the other hand, February’s (2021) NFP print of 536,000 against the market expectation of 182,000 was a positive surprise with the deviation posting 1.76 for that particular release. A better-than-expected NFP print is seen as a USD-positive development and vice versa.
Finally, we calculated the correlation coefficient (r) to figure out at which time frame gold had the strongest correlation with an NFP surprise. When r approaches -1, it suggests there is a significant negative correlation, while a significant positive correlation is identified when r moves toward 1. Since gold is defined as XAU/USD, an upbeat NFP reading should cause it to edge lower and point to a negative correlation.
Results
There were 13 negative and 22 positive NFP surprises in the previous 35 releases, excluding data for March 2021 and March 2023. On average, the deviation was -0.82 on disappointing prints and 1.43 on strong figures. 15 minutes after the release, gold moved up by $4.95 on average if the NFP reading fell short of market consensus. On the flip side, gold declined by $4.78 on average on positive surprises. This finding suggests that investors’ immediate reaction is likely to be slightly more significant to a weaker-than-forecast print.
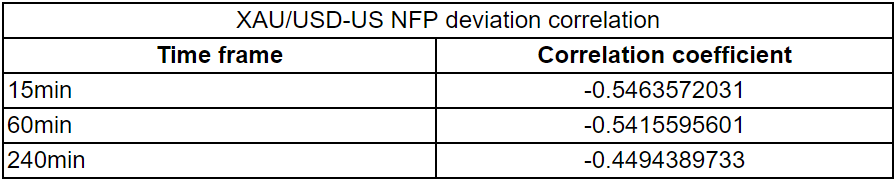
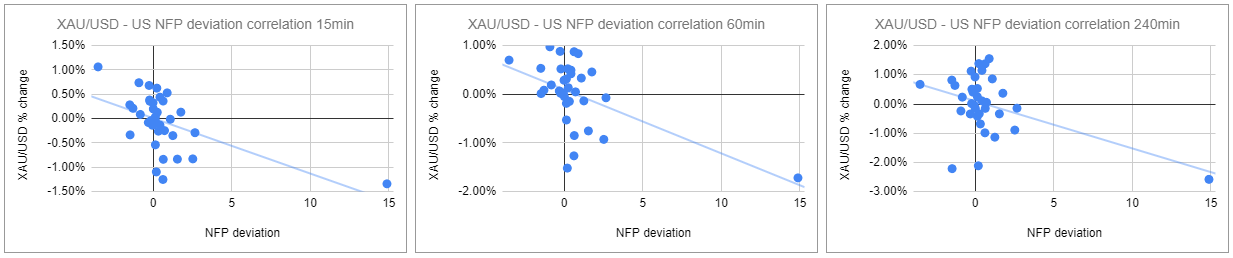
The correlation coefficients we calculated for the different time frames mentioned above are not close enough to -1 to be considered significant. The strongest negative correlations are seen 15 minutes and one-hour after the releases, with the r standing at around -0.54. Four hours after the release, r edges higher to -0.44.
Several factors could be coming into play to weaken gold’s inverse correlation with NFP surprises. A few hours after the NFP release on Friday, investors could look to book their profits toward the London fix, causing gold to reverse its direction after the initial reaction.
More importantly, underlying details of the jobs report, such as wage inflation, as measured by the Average Hourly Earnings, and the Labor Force Participation rate, could be having an impact on market reaction. The US Federal Reserve (Fed) clings to its data-dependent approach and the headline NFP print, combined with these other data, could drive the market pricing of the Fed's next policy action.
Gold FAQs
Why do people invest in Gold?
Gold has played a key role in human’s history as it has been widely used as a store of value and medium of exchange. Currently, apart from its shine and usage for jewelry, the precious metal is widely seen as a safe-haven asset, meaning that it is considered a good investment during turbulent times. Gold is also widely seen as a hedge against inflation and against depreciating currencies as it doesn’t rely on any specific issuer or government.
Who buys the most Gold?
Central banks are the biggest Gold holders. In their aim to support their currencies in turbulent times, central banks tend to diversify their reserves and buy Gold to improve the perceived strength of the economy and the currency. High Gold reserves can be a source of trust for a country’s solvency. Central banks added 1,136 tonnes of Gold worth around $70 billion to their reserves in 2022, according to data from the World Gold Council. This is the highest yearly purchase since records began. Central banks from emerging economies such as China, India and Turkey are quickly increasing their Gold reserves.
How is Gold correlated with other assets?
Gold has an inverse correlation with the US Dollar and US Treasuries, which are both major reserve and safe-haven assets. When the Dollar depreciates, Gold tends to rise, enabling investors and central banks to diversify their assets in turbulent times. Gold is also inversely correlated with risk assets. A rally in the stock market tends to weaken Gold price, while sell-offs in riskier markets tend to favor the precious metal.
What does the price of Gold depend on?
The price can move due to a wide range of factors. Geopolitical instability or fears of a deep recession can quickly make Gold price escalate due to its safe-haven status. As a yield-less asset, Gold tends to rise with lower interest rates, while higher cost of money usually weighs down on the yellow metal. Still, most moves depend on how the US Dollar (USD) behaves as the asset is priced in dollars (XAU/USD). A strong Dollar tends to keep the price of Gold controlled, whereas a weaker Dollar is likely to push Gold prices up.
Author

Eren Sengezer
FXStreet
As an economist at heart, Eren Sengezer specializes in the assessment of the short-term and long-term impacts of macroeconomic data, central bank policies and political developments on financial assets.
















