U.S. Equity Market

S&P 500 Valuation Indicator
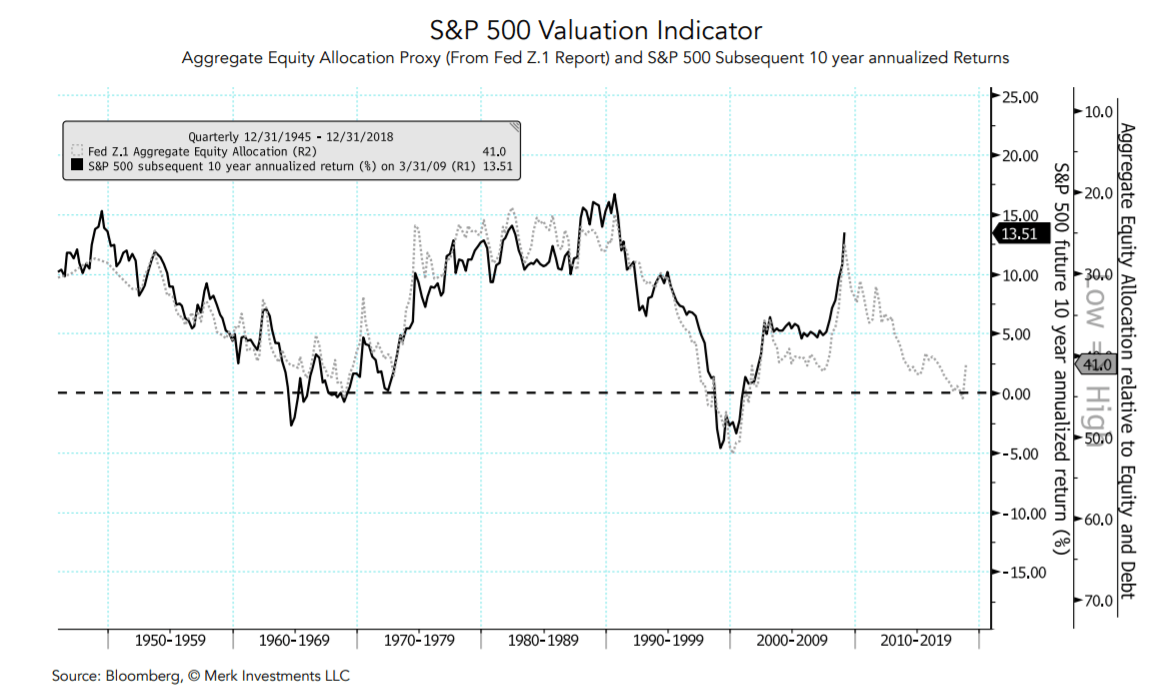
Analysis: If history is any guide, this chart suggests annualized S&P 500 returns (w/o dividends) might be in the low single digits annualized over the coming 10
year period. The grey dotted line is the market value of US equity divided by the total market value of US equity and debt, which is used as a proxy for
aggregate equity allocation. At 41.0% the equity allocation is relatively high currently. The data comes from the quarterly Federal Reserve Z.1 report, the
series will be updated next in late June. Chart Framework: I’d likely get positive on the longer term outlook for the S&P 500 at an allocation below 30%, which
would likely only be after a substantial bear market.
Download The Full Merk Investments
Author

Axel Merk
Merk Hard Currency Fund
Axel Merk is the Founder and President of Merk Investments. Merk is an expert on macro trends, hard money, international investing and on building sustainable wealth.


