US employment data in focus
Release: Thursday at 13.30pm BST
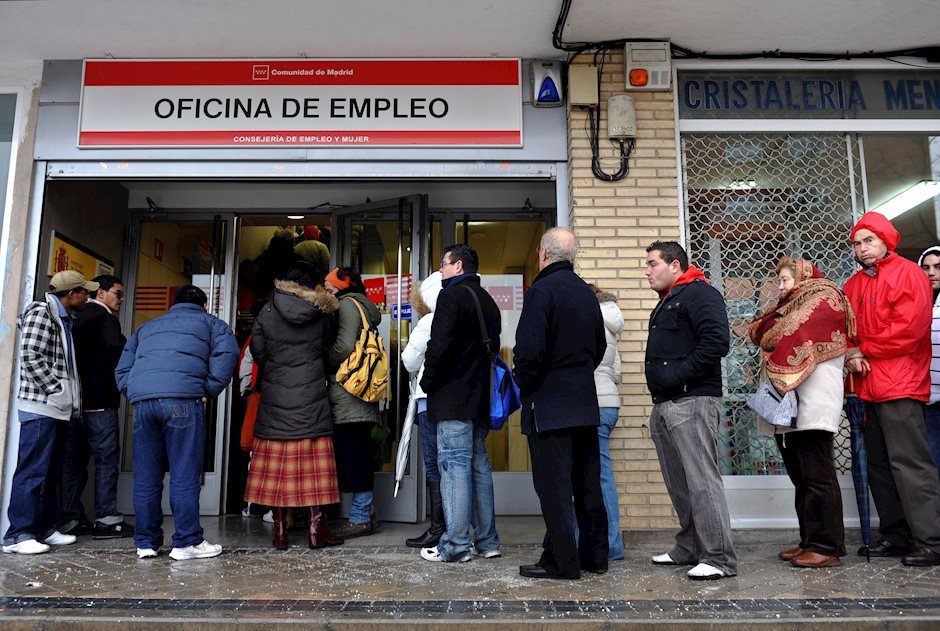
US employment figures deliver an unparalleled insight into the condition of the world’s largest economy.
Employment is a widely watched indicator due to its timeliness, accuracy and importance, as well as being considered a leading indicator of consumer spending.
The non-farm payrolls release is a measure of new payrolls added by private and government organisations in the US, reported each month by the Bureau of Labour Statistics (BLS).
Higher-than-expected data typically favours a USD rally.
Weaker-than-expected data tends to weigh, triggering a USD decline.
According to the US Bureau of Labour Statistics]:
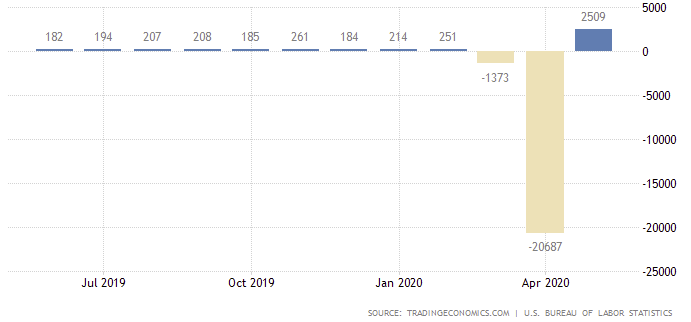
Total non-farm payroll employment increased by 2.5 million in May, reflecting a limited resumption of economic activity that had been curtailed due to the coronavirus pandemic and efforts to contain it. Employment fell by 1.4 million and 20.7 million, respectively, in March and April. Despite the over-the-month increase, non-farm employment in May was 13 percent below its February level.
3.5 million non-farm payrolls are to be added to the US economy in June, according to the median estimate. Some desks, however, feel a higher-than-expected print may emerge, with forecasts as high as 9 million.
What Bloomberg’s economists say:
‘The June jobs report will reflect a sweet spot as firms still had sufficient funds to keep workers on payrolls in the beginning of the month, while Covid-19 cases in Sun-Belt states did not start accelerating until later in June. The focus will quickly shift to whether job growth remains sustainable going into the fall’.
–Yelena Shulyatyeva, Andrew Husby and Eliza Winger
Unemployment
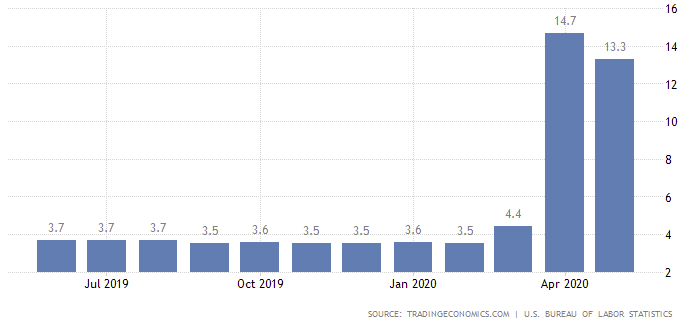
Unemployment in May dropped to 13.3%, down from April’s 14.7% print.
The unemployment rate, also referred to as ‘joblessness’, is a closely followed economic indicator. The unemployment rate is derived from a monthly survey called the Current Population Survey (CPS), made up of approximately 60,000 households.
The BLS noted the unemployment rate and the number of unemployed persons is up by 9.8 percentage points and 15.2 million, respectively, since February.
The consensus range for June’s unemployment rate falls in between 12.0% to 12.5%.
US Average Hourly Earnings
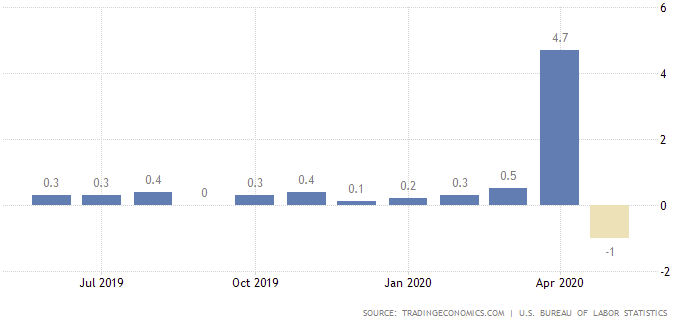
Average hourly earnings, the average dollar a private employee makes each hour in the US, currently stands at $29.75 for May, down 29 cents following April’s $1.35 gain.
The BLS noted:
In May, average hourly earnings for all employees on private non-farm payrolls fell by 29 cents to $29.75, following a gain of $1.35 in April. Average hourly earnings of private-sector production and nonsupervisory employees decreased by 14 cents to $25.00 in May. The decreases in average hourly earnings largely reflect job gains among lower-paid workers; this change put downward pressure on the average hourly earnings estimates.
Consensus anticipates average hourly earnings to decline 0.8% in June.
Consumer Confidence
Each month the Conference Board surveys a nationwide sample of 5,000 households, consisting of five questions. The report essentially measures the level of confidence individual households have in the performance of the economy.
Consumer confidence rose to 98.1 in June, exceeding forecasts, led by increased optimism amid businesses reopening.
The Conference Board noted:
The Conference Board Consumer Confidence Index increased in June, after virtually no change in May. The Index now stands at 98.1 (1985=100), up from 85.9 in May. The Present Situation Index – based on consumers’ assessment of current business and labour market conditions – improved from 68.4 to 86.2. The Expectations Index – based on consumers’ short-term outlook for income, business, and labour market conditions – increased from 97.6 in May to 106.0 this month.
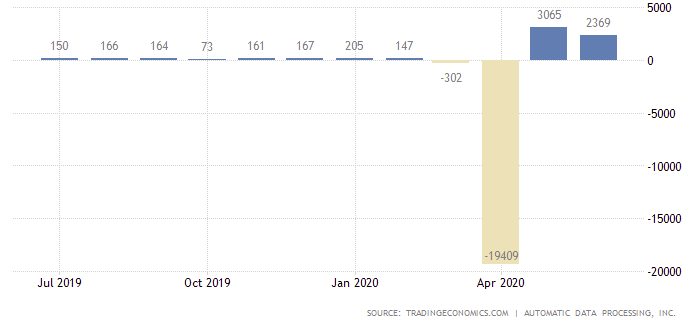
ADP Non-Farm Employment Change
Published by the ADP Research Institute, in collaboration with Moody’s Analytics, the ADP non-farm employment change estimates the number of employed during the prior month, excluding the farming and government industry.
The report, derived from ADP’s payroll database (one-fifth of US private payroll employment), measures the change in total non-farm private employment each month on a seasonally-adjusted basis. ADP is widely considered an early snapshot of the upcoming BLS report.
Private sector employment increased by 2,369,000 jobs in June, according to the ADP National Employment Report[6], below consensus at 2,850,000.
‘Small business hiring picked up in the month of June’, said Ahu Yildirmaz, vice president and co-head of the ADP Research Institute. ‘As the economy slowly continues to recover, we are seeing a significant rebound in industries that once experienced the greatest job losses. In fact, 70 percent of the jobs added this month were in the leisure and hospitality, trade and construction industries’.
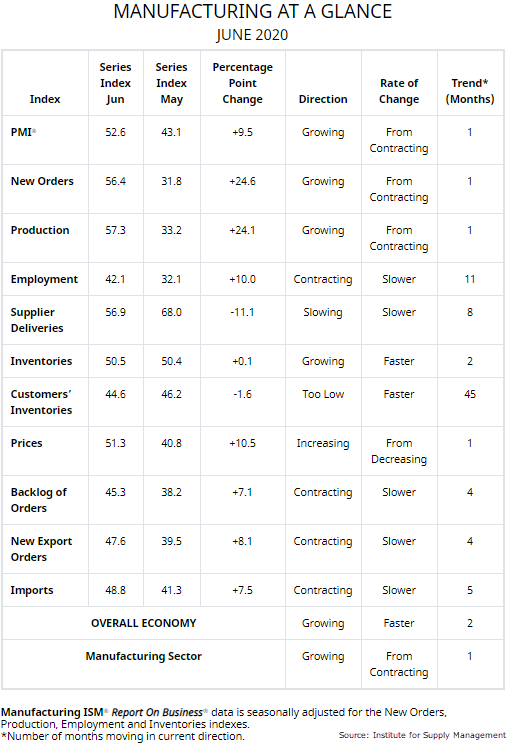
ISM Manufacturing PMI
This is one of the first pieces of economic data released each month, based on a survey of approximately 300 purchasing managers.
Economic activity in the manufacturing sector grew in June, with the overall economy notching a second month of growth after one month of contraction, reported the nation’s supply executives in the latest Manufacturing ISM Report on Business[7]. June’s PMI registered 52.6, rising 9.5 percentage points from May’s reading of 43.1 and firmly overthrowing consensus at 49.5.
June signifies manufacturing is entering an expansion cycle after the disruption caused by the COVID-19 pandemic. Respondents were overall positive, reversing March’s cautious trend.
FP Markets Technical Outlook
Economic Indicators suggest the US economy is beginning to recover, perhaps pointing to the possibility of an upbeat employment release Thursday.
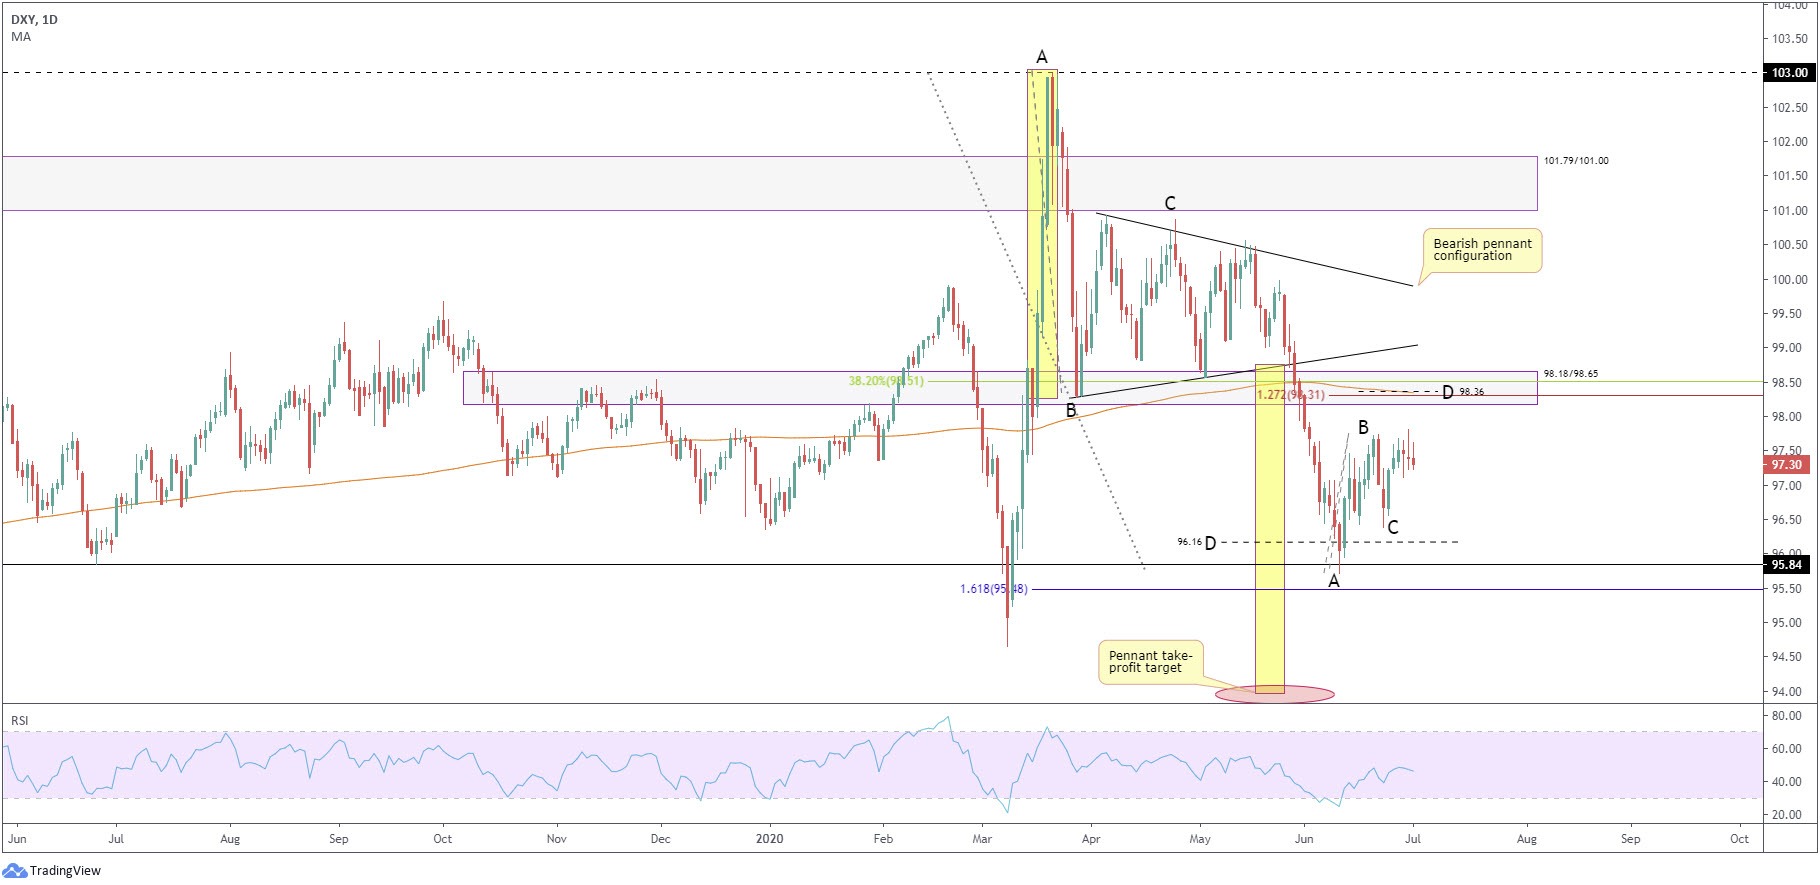
The technical side of things on the US dollar index, a measure of the dollar’s value against a basket of six major currencies, also offers an interesting outlook.
The recent recovery from daily support at 95.84, accompanied by a daily AB=CD pattern completing at 96.16, with the latter regarded as a basic bullish configuration among harmonic traders, has positioned price action within close proximity to daily supply at 98.18/98.65. This is a powerful area, housing the 200-day simple moving average at 98.35, a 38.2% daily Fib level at 98.51, a 127.2% daily Fib ext. level at 98.31 and a potential daily AB=CD bearish pattern at 98.36. Note also the 38.2% Fib level represents a common initial take-profit target out of the larger AB=CD pattern (96.16).
Indicator-based traders will also acknowledge the RSI oscillator recently approached its mid-way 50.00 point, after recovering from oversold levels in early June.
Worse-than-expected data indicates a dip to 96.39 (June 23rd low). Stronger-than-expected figures, however, may see daily supply at 98.18/98.65 make an entrance, which, in light of its confluence, puts forward a strong case for a bearish USD.
Author

FP Markets Team
FP Markets


