US 2/10 Yr Yield Setting Up For Another Inversion

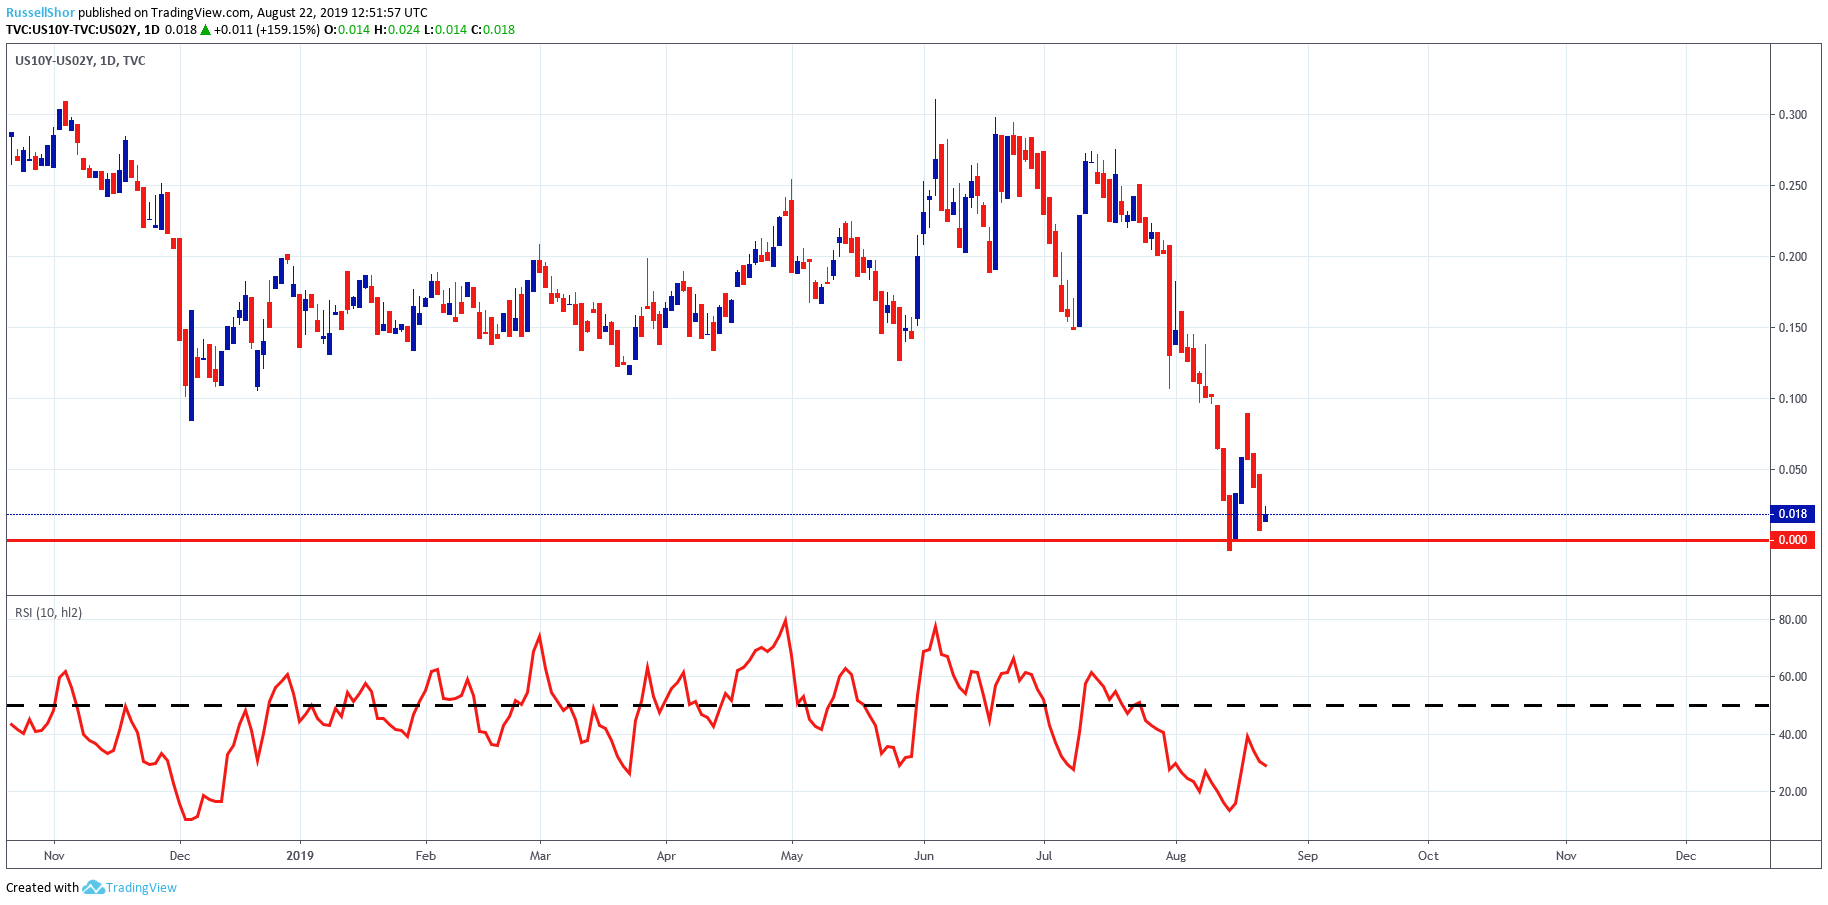
The below is the daily chart of the spread between the US 10-Yr and 2-Yr treasuries. Last week it briefly inverted before flattening. However, it’s heading towards an inversion for the second time in just over a week. This will be signalled when the candlesticks drop below the red horizontal level at 0. The RSI remains on the bearish side of 50 and is indicative of an underlying downwards pressure. We continue to monitor.
Past performance is not an indicator of future results.
CHART SOURCE: WWW.TRADINGVIEW.COM
Author

Russell Shor (MSTA, CFTe, MFTA) has an Honours Degree in Economics from the University of South Africa and holds the coveted Certified Financial Technician and Master of Financial Technical Analysis qualifications from the Interna


