US 10 year T-Note yield in trading range waiting the FOMC

Market Recap
|
Market Recap |
% |
Close Price |
|
VIX |
6.21% |
9.92 |
|
AUDUSD |
0.43% |
0.7558 |
|
EURO STOXX 50 |
0.42% |
3,596.00 |
|
GBPUSD |
-0.17% |
1.3318 |
|
EURUSD |
-0.23% |
1.1742 |
|
WTI Crude Oil |
-1.47% |
57.14 |
Prices as of previous day instrument closing.
-
DJIA and S&P500 made a record close while Nasdaq Composite slid 12.76 points or 0.19% to 6,862.31. DJIA gained 118.77 points or 0.49% at 24,504.8 and the S&P500 closed at 2,664.11, up 4.12 points or 0.15%. 3,761 (52.9%) stocks traded on AMEX, Nasdaq and NYSE closed above their 50 day moving average and 51.2% of shares declined. Risk appetite rose in the spot market but the CBOE VIX index rallied to 9.92, up 6.21% as investors were looking to buy protection as options premium are historically lows. Stocks indices rose in Europe as the DAX closed at 13,183.53, up 0.46% and the FTSEMIB rose 36.34 points or 0.16% to 22,727.32.
-
In the FX market EURUSD lost 0.23% at 1.1742 as the US Dollar Index rose 0.25% to 94.101. USDJPY closed at 113.33, down 0.19%. EURGBP closed at 0.8816, down 0.07% and US 10 year T-Note yields rose 0.52% to 240 basis points.
-
Gold rose 0.19% to 1,244.49 $/oz and Silver gained 0.12% to 15.72 $/oz. Natural Gas slid 5.3%.
Chart of the day
US 10 year T-Note yield (daily timeframe)
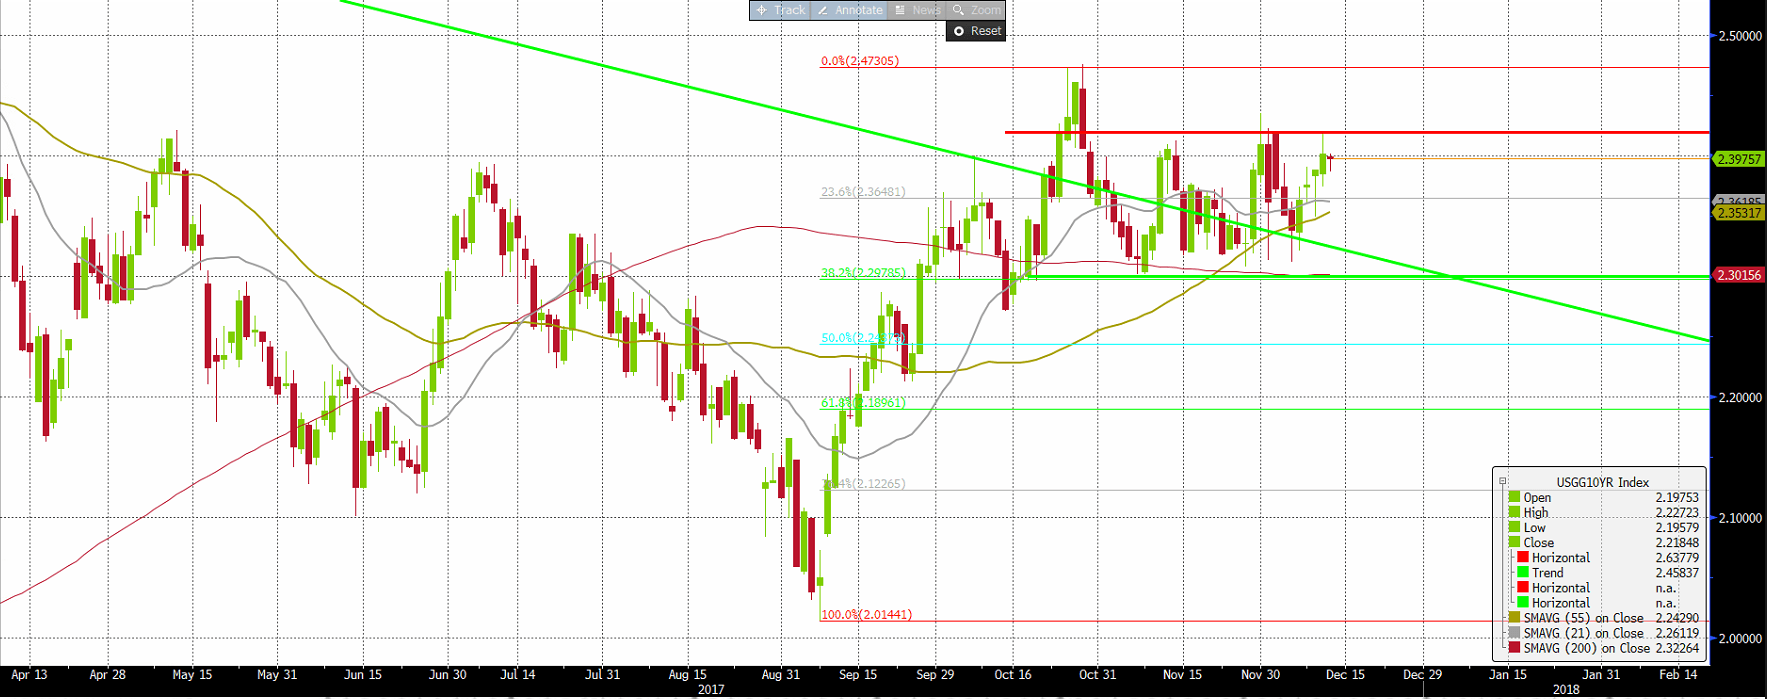
10 year Treasury Note yield developed a short term trading range between 2.42 and 2.30. Above the higher side of the range level 2.47 should be the most relevant resistance in the short term and beneath 2.30 the yield could retrace to 2.18.
US 10 year T-Note yield (weekly timeframe)
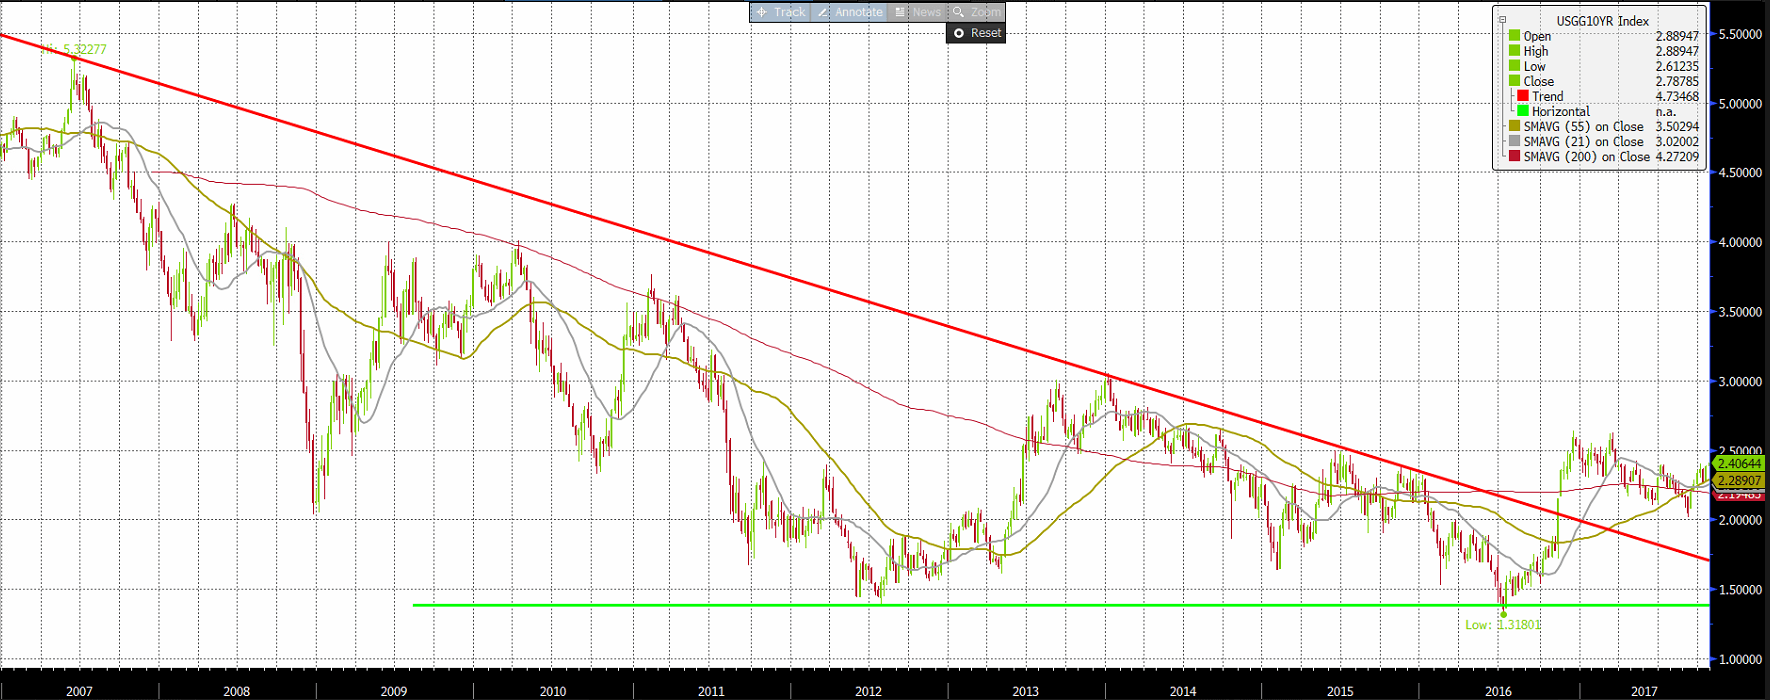
The yield ended its long term downtrend as it broke the supply line that linked lower highs and made a double bottom in area 137 basis points. The most relevant psychological level is 3% in the medium term as the last time that this level was reached was in 2014.
Economic Calendar
|
Wednesday December 13, 2017 CET Time |
Forecast |
Previous | ||
|
10:30 |
GBP |
Jobless Claims Change (Nov) |
4.0K |
1.1K |
|
10:30 |
GBP |
Unemployment Rate (Oct) |
4.2% |
4.3% |
|
11:00 |
EUR |
Employment Change (3Q; QoQ) |
0.3% |
0.4% |
|
11:00 |
EUR |
Industrial Production sa (Oct; MoM) |
0.0% |
-0.6% |
|
13:00 |
OPEC Monthly Oil Market Report | |||
|
13:00 |
USD |
MBA Mortgage Applications (Dec 8) |
4.7% | |
|
14:30 |
USD |
CPI (Nov; MoM) |
0.4% |
0.1% |
|
16:30 |
USD |
EIA Crude Oil Stocks change (Dec 8) |
-5610K | |
|
20:00 |
USD |
FOMC Rate Decision |
1.25-1.50% |
1.00-1.25% |
|
20:30 |
USD |
FOMC Press Conference | ||
The Fed is expected to raise rates to a range of 1.25-1.50% today at a highly anticipated decision at 20:00 CET. This is then followed by a press conference held by Yellen. As the market has largely priced in the rate hike, we don’t expect a bullish move per se. However, downside risk might be elevated on any dovish comments regarding policy outlook for 2018.
The day is started with UK employment data at 10:30 CET. Unemployment rate is forecasted to fall to 4.2%, while claimant count to increase to 4,000. Employment change and industrial production for the euro zone is released at 11:00 CET. In the afternoon, weekly mortgage applications precede November’s CPI from the US. Inflation is expected to rise 0.4% MoM as traders could leverage this information into the rate decision. Finally, increased crude oil price volatility can be expected at 13:00 and 16:30 CET when the monthly OPEC report and inventories are released respectively.
Technical Analysis
EURUSD (Daily timeframe)
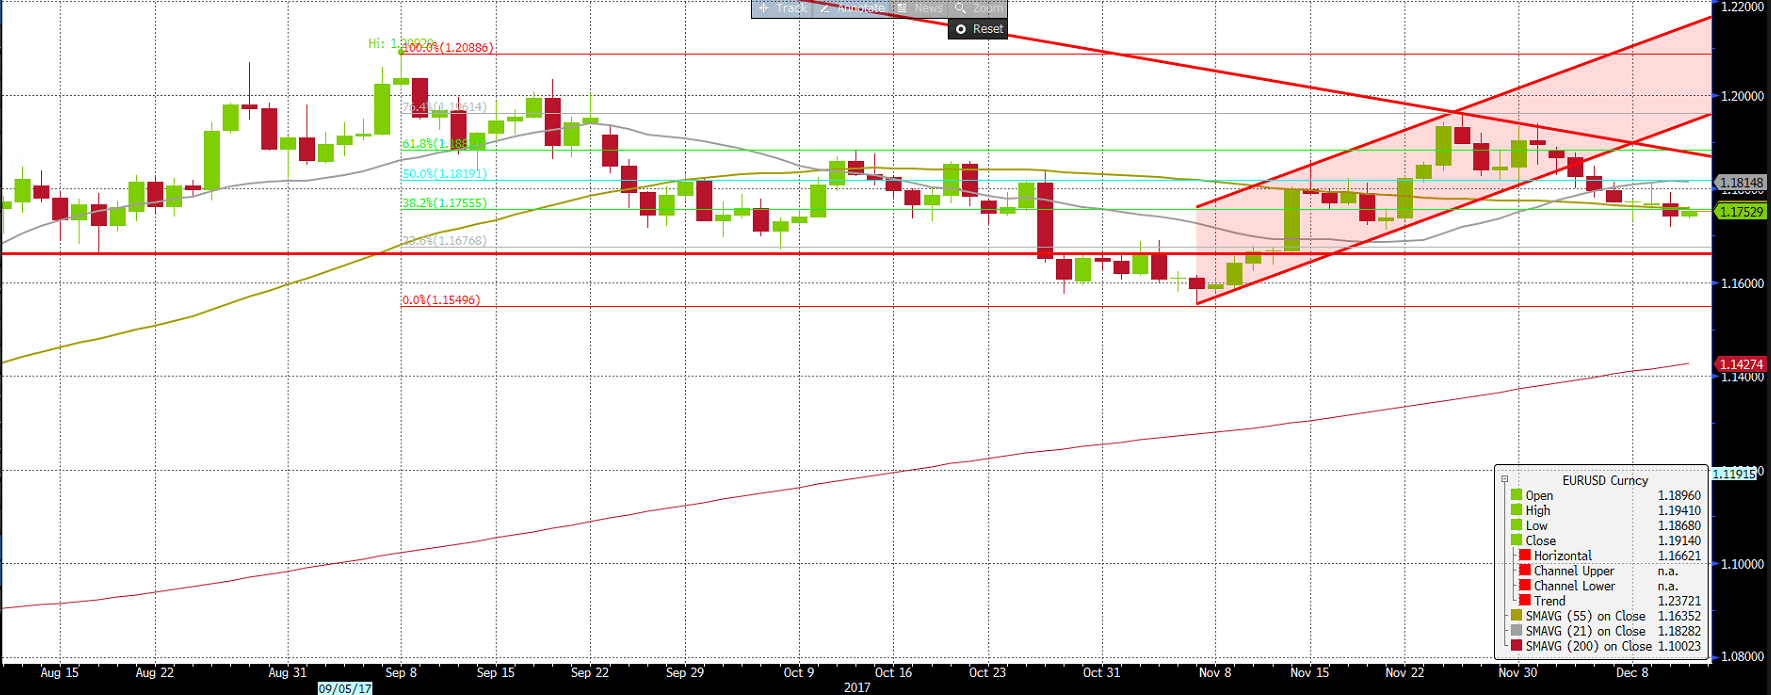
EURUSD is making lower highs and lower lows after it broke the lower side of the bullish channel. Short term supports at 1.665 and 1.550 while a breakout of the short term supply line trigger momentum trading.
XAUUSD (Daily timeframe)
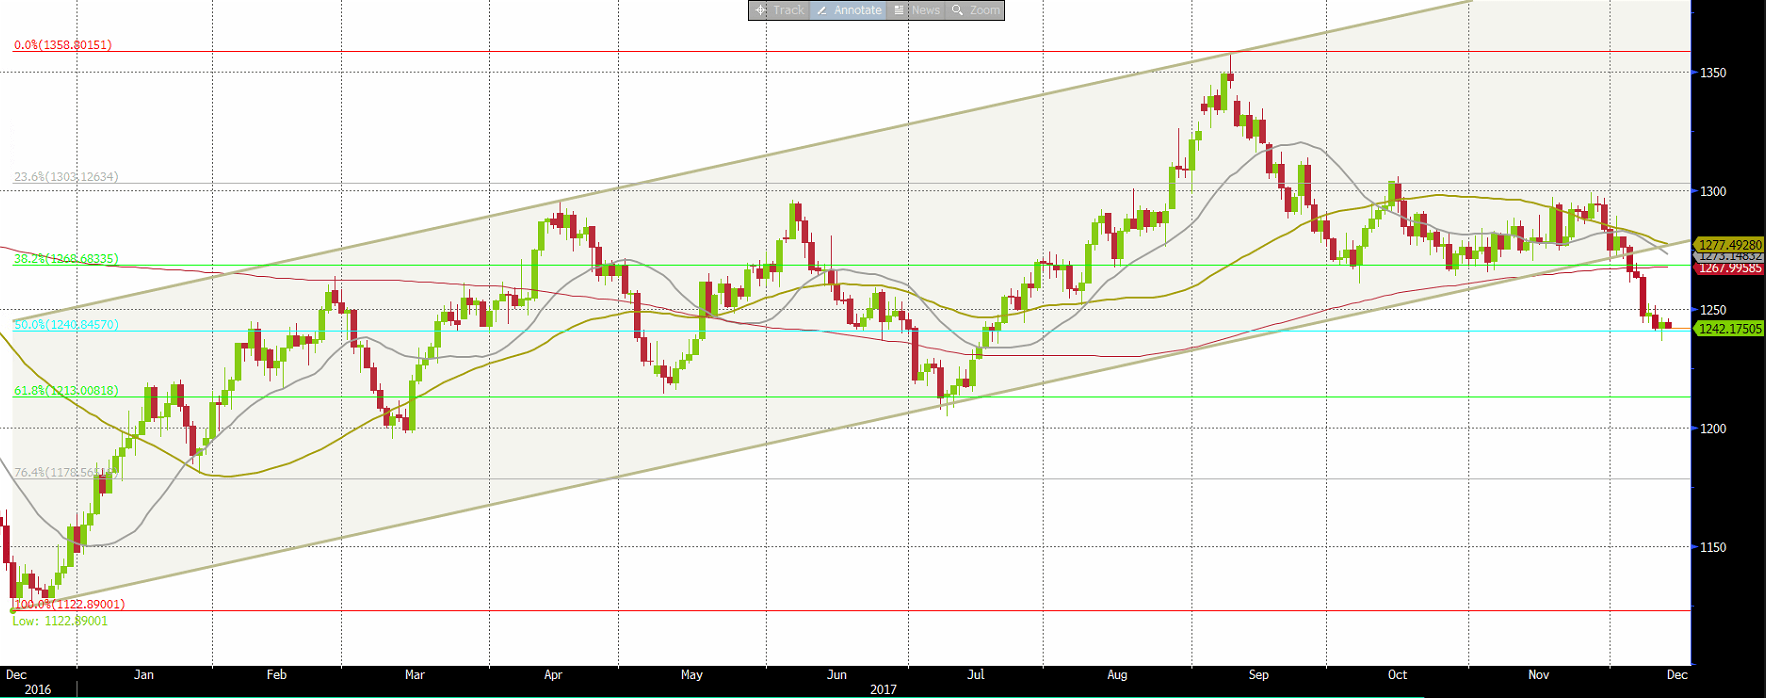
Gold found support on the 50% Fibonacci retracement of the bullish trend; beneath this level the shiny metal could test 1,213 and then 1,200. In case of a rally the commodity it may test its 200 day MA near 1,267 and then make a pullback in area 1,280.
AUDUSD (Daily timeframe)
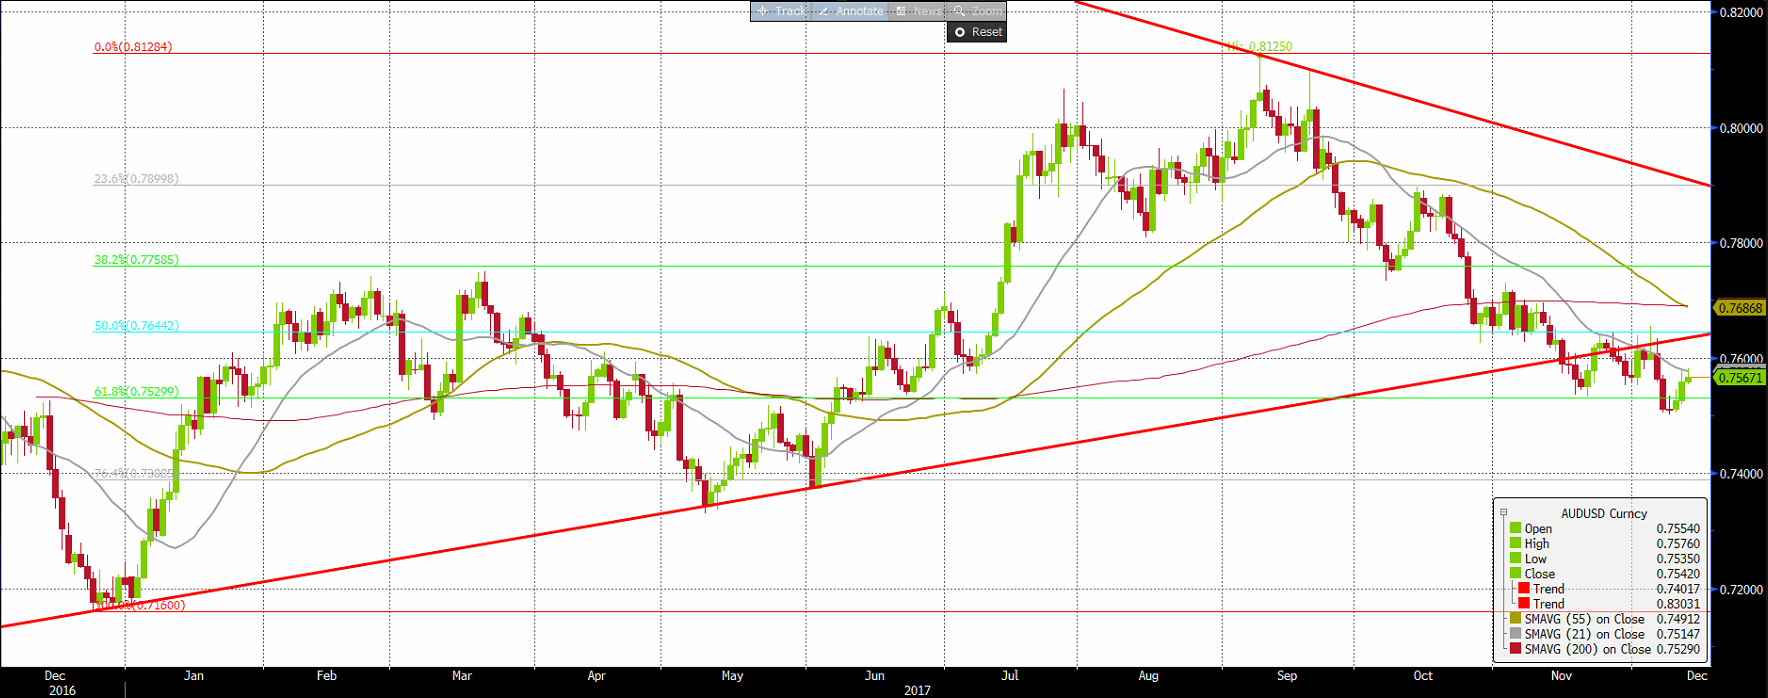
The rate went below the 61.8% Fibonacci retracement of the bullish trend started 12 months ago but then rebounded. Below 0.75 AUDUSD could retrace to 0.74 and then make a 100% retracement near 0.7160. Above 0.7660 AUDUSD could rally to test its supply line that links lower highs generated in September.
EURJPY (daily timeframe)
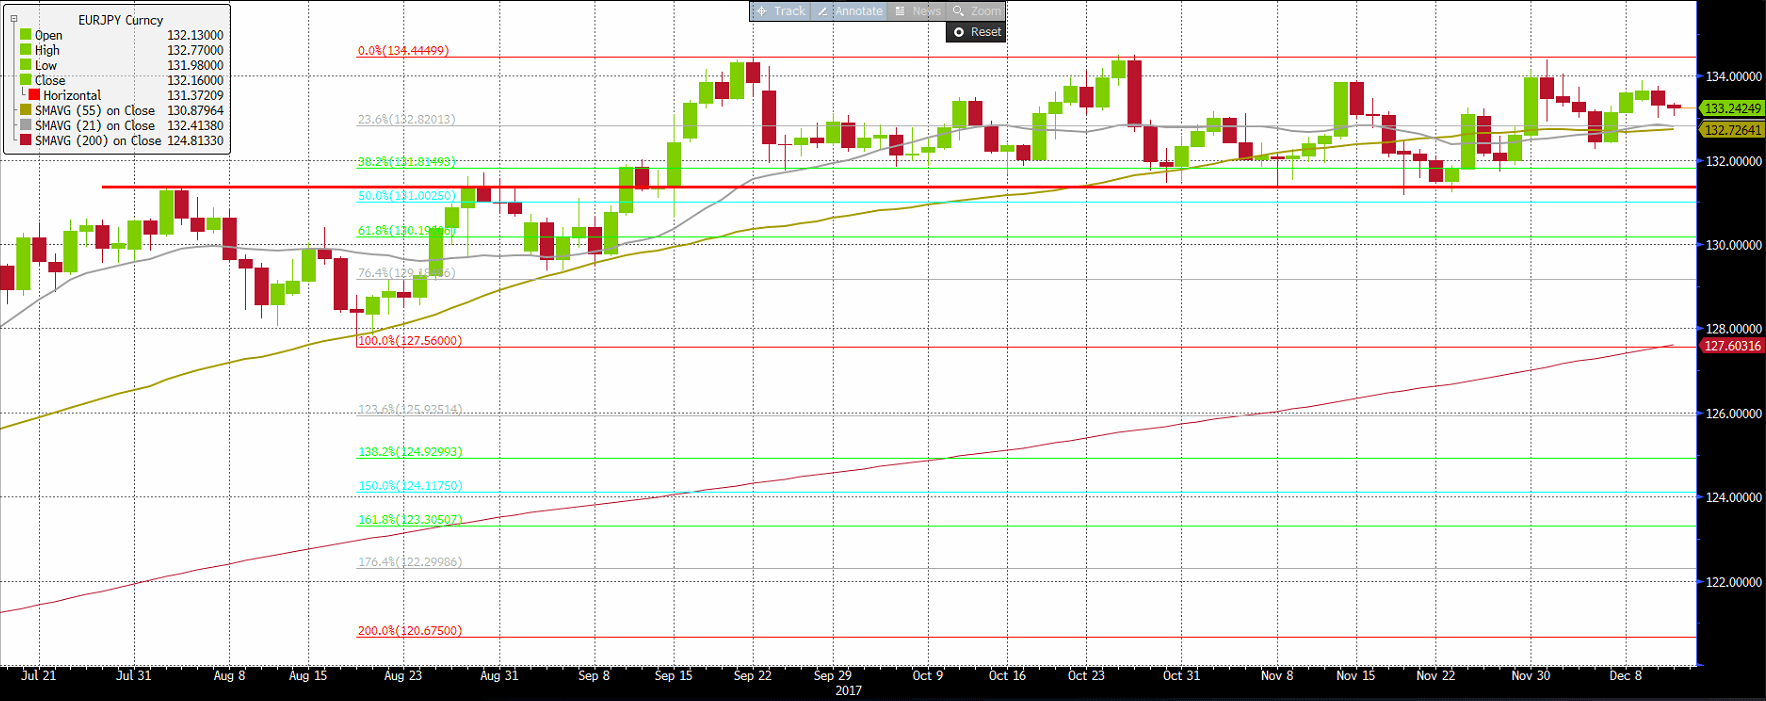
EURJPY is in a medium term trading range with lower side at 131.30 while the higher side is at 134.5. Above the higher side EURJPY could test 137 and then 140 while below 131.30 the rate could slide to 130 and then to 127.5.
Author

ALB Team
ALB Forex Trading
ALB Research Department is the research department of ALB Forex Trading Ltd.


