US 10 T-Note yield rally could lift the US dollar

Market Recap
|
Market Recap |
% |
Close Price |
|
NATGAS(Feb 18) |
4.30% |
2.957 |
|
USOIL(Feb18) |
1.99% |
62.96 |
|
USDCHF |
0.59% |
0.983 |
|
EURUSD |
-0.25% |
1.1937 |
|
USDJPY |
-0.39% |
112.65 |
|
XAUUSD |
-0.57% |
13112.85 |
Prices as of previous day instrument closing.
-
US indices closed off their intraday highs but managed to make another record close. This year started with bullish sentiment as YTD the DJIA is up 2.70%, Nasdaq Composite 3.77% and the S&P500 already rose 2.91% . The performance of the stock market in US is not idiosyncratic as indices across the globe are rallying: the Nikkei rose 4.49% YTD while the DAX in Germany gained 3.62% and in Italy the FTSEMIB rose to 23,000 point, with a +5.27% YTD performance. All percentages are calculated in local currency, thus considering FX rates the performance of the NIKKEI for European Investors is of +5.72% year to date.
-
In the FX market EURUSD slid 0.25% to 1.1937 while GBPUSD closed at 1.3540, down 0.2%. USDJPY dropped 0.38% to 112.65 and USDCHF rallied to 0.9830, up 0.59%. AUDUSD slid for the second consecutive session to 0.7824, down 0.22% while the Kiwi dollar overperformed the Aussie dollar but NZDUSD slid as well to 0.7163, down 0.18%. USDCAD rebounded to 1.2464 or 0.34% after last week it closed in negative territory 4 session out of 5.
-
Gold closed at 1,312.85 $/oz, down 0.57% and US 10 year T-Note Yield rose to 255bp, up 2.94%. Crude Oil WTI rallied 1.99% to 62.96 $/barrel. The last time WTI traded this price was in June 2015.
Chart of the day
US 10 year T-Note yield (Weekly timeframe)
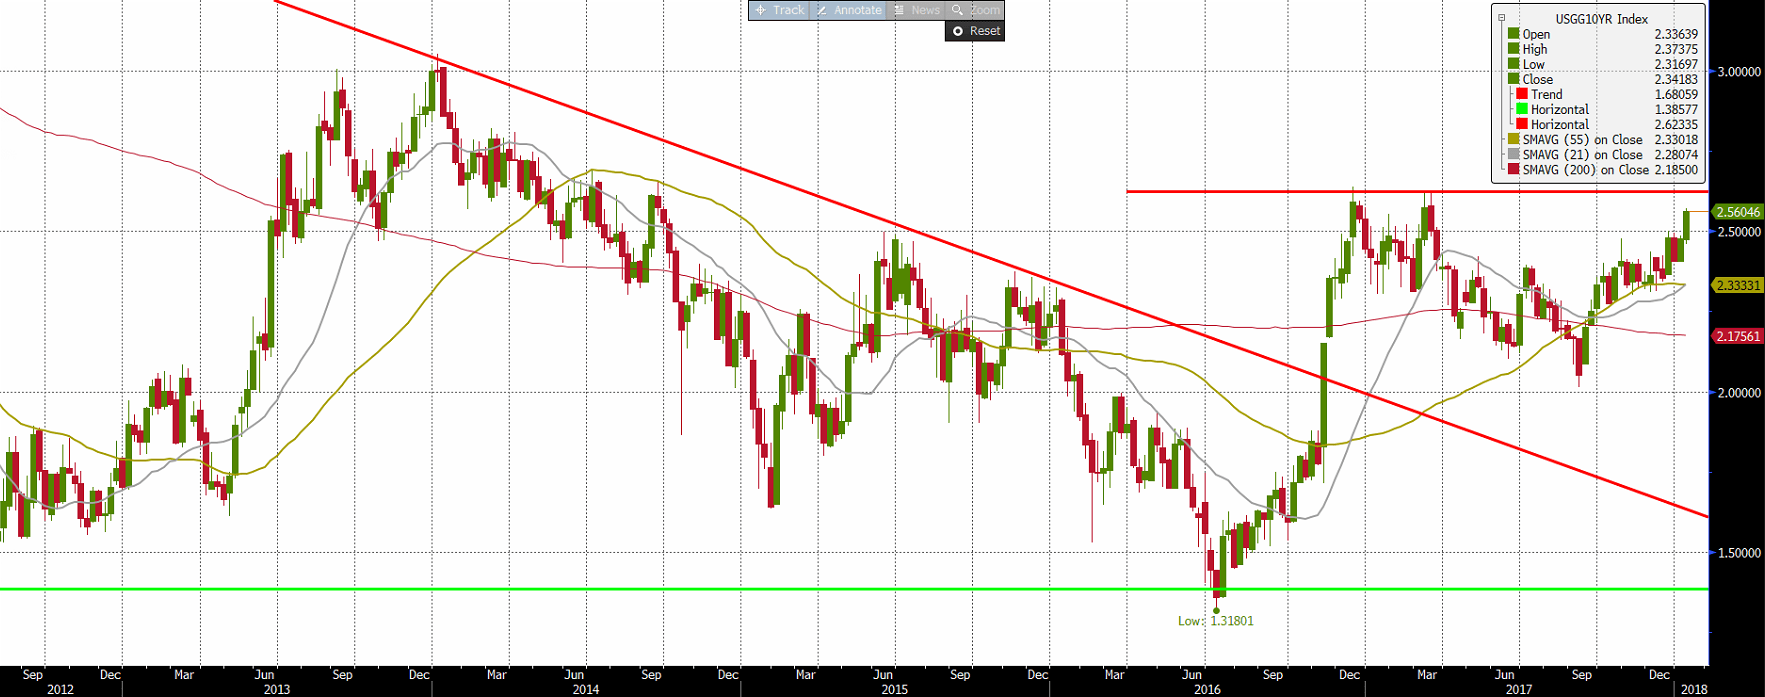
The Yield of the 10 year sovereign bond of US rallied and it may test 2.63 area. Above this static resistance the yield could test the psychological level 3%. This level was reached the last time on January 2014. Beneath 2.5 a retracement to 2.33 it may be possible.
|
Wednesday January 10, 2017 CET Time |
Forecast |
Previous | ||
|
10:30 |
GBP |
Manufacturing Production (MoM) (Nov) |
0.3% |
0.1% |
|
10.30 |
GBP |
Trade Balance (Nov) |
-11.00B |
-10.78B |
|
10:30 |
GBP |
Trade Balance Non-EU (Nov) |
-2.60B |
-2.38B |
|
14:30 |
USD |
Export Price Index (MoM) (Dec) |
0.3% |
0.5% |
|
14:30 |
USD |
Import Price Index (MoM) (Dec) |
0.4% |
0.7% |
|
14:30 |
USD |
Building Permits (MoM) (Nov) |
1.5% |
3.5% |
|
16:30 |
USD |
Crude Oil Inventories |
|
-7.419 |
|
19:30 |
USD |
FOMC Member Bullard Speaks |
|
|
UK trade balance data and Manifacturing Production will likely increase the volatility of the British pound. Crude Oil inventories will test the rally of the commodity. Crude Oil WTI, after it risked to reach 20 $/barrel in 2016, more than doubled from the multiyear low 26.48 $/barrel. If commodities price will increase they could bring inflationary pressures and accelerate the path of interest rate hikes in G10 economies.
Technical Analysis
EURUSD (Daily timeframe)
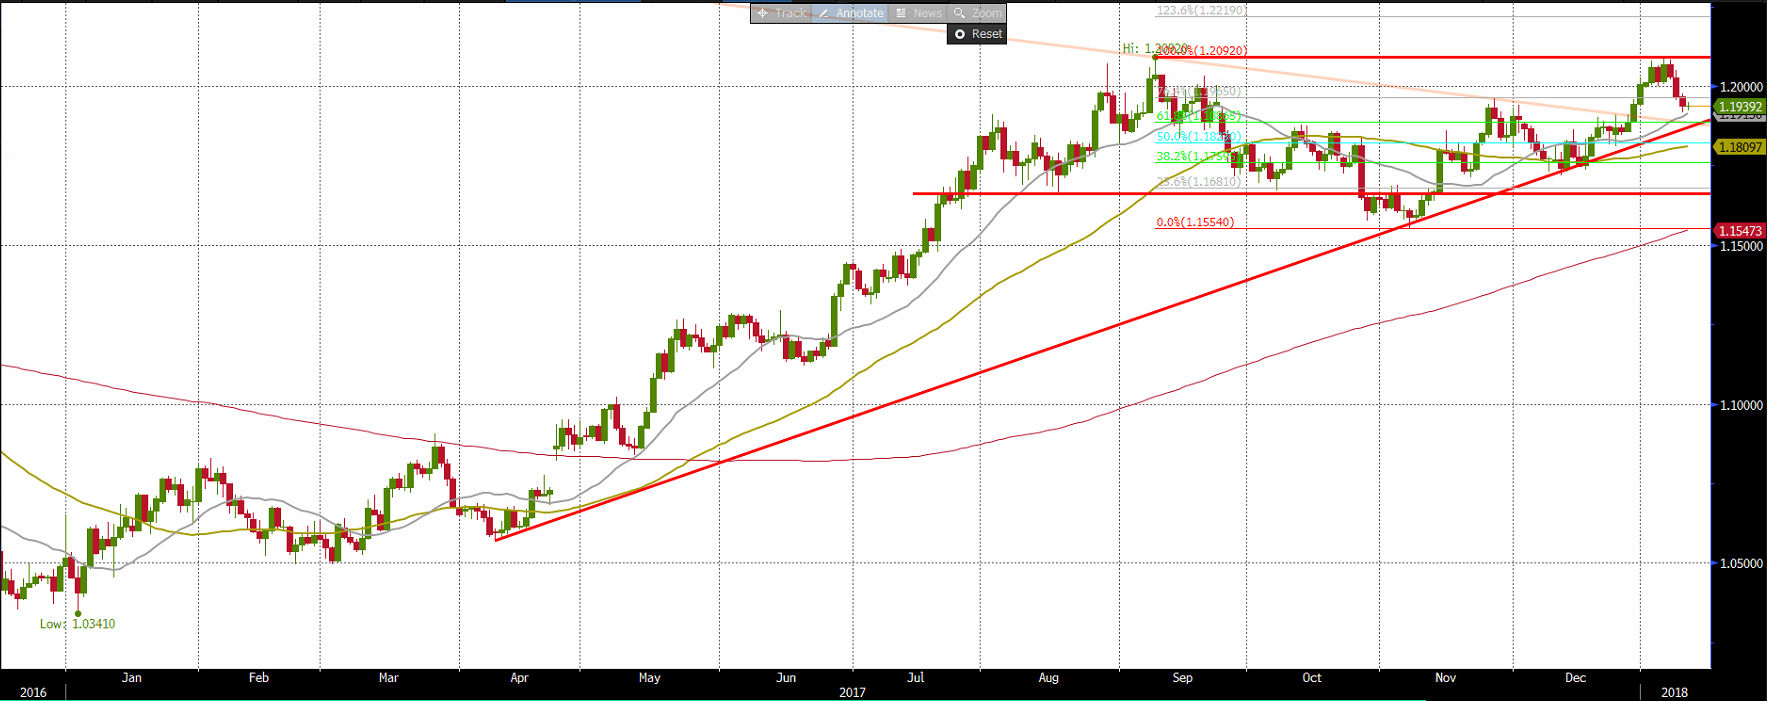
EURUSD could not make the breakout of the static resistance 1.2092 and it dropped for 3 consecutive session. Beneath the dynamic trendline that links higher lows the rate it may test 1.1675 and then 1.1554. This level is overlapped to the 200 day MA. A consolidation above 1.21 could lift EURUSD to 1.24 where it could test a multiyear dynamic resistance.
GBPUSD (Daily timeframe)
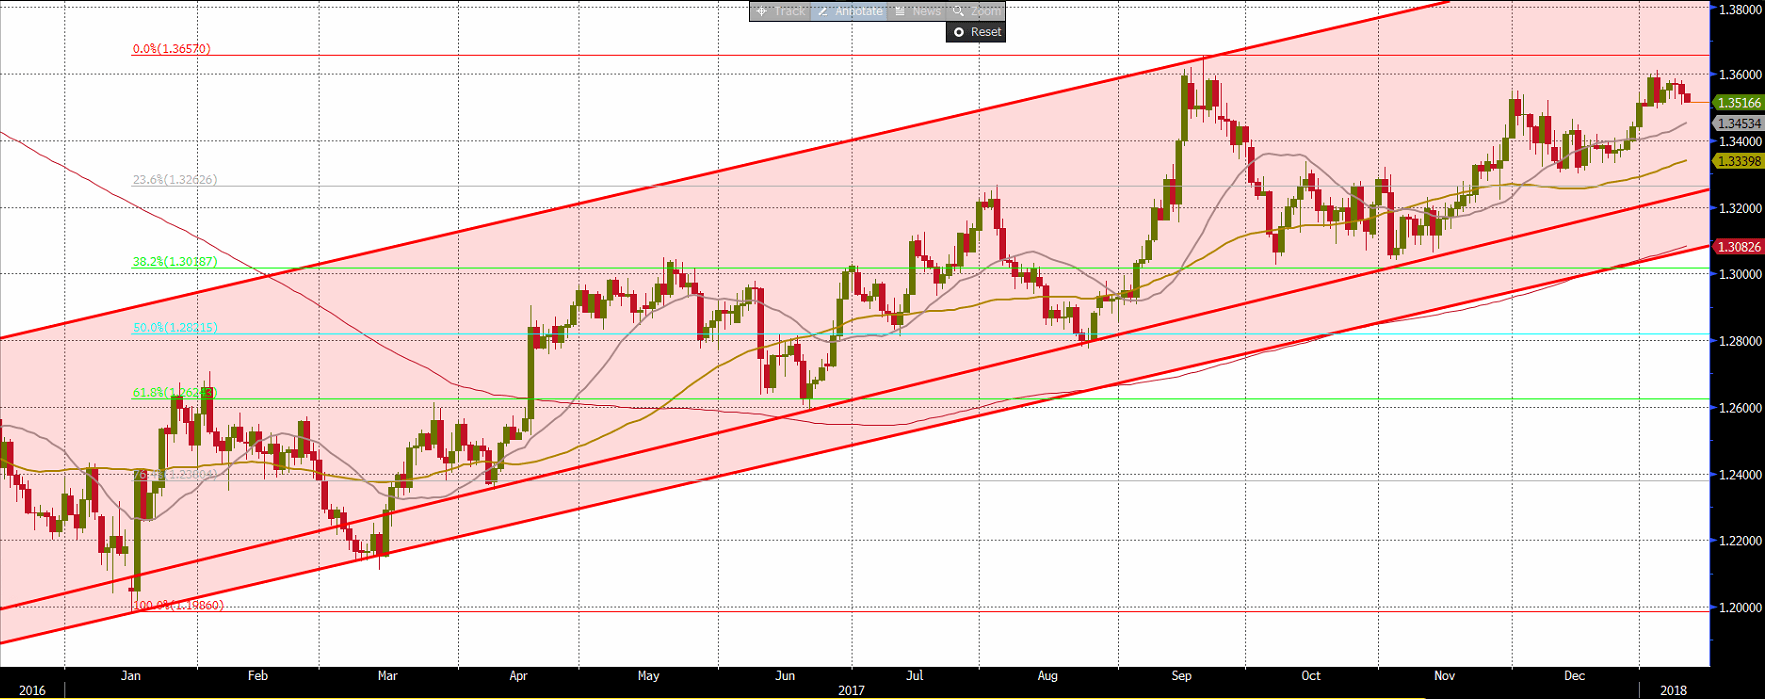
The rate below 1.35 could retrace to 1.3340 and then test area 1.32. Above 1.3660 GBPUSD could rally to test the higher side of the bullish channel.
AUDUSD (Daily timeframe)
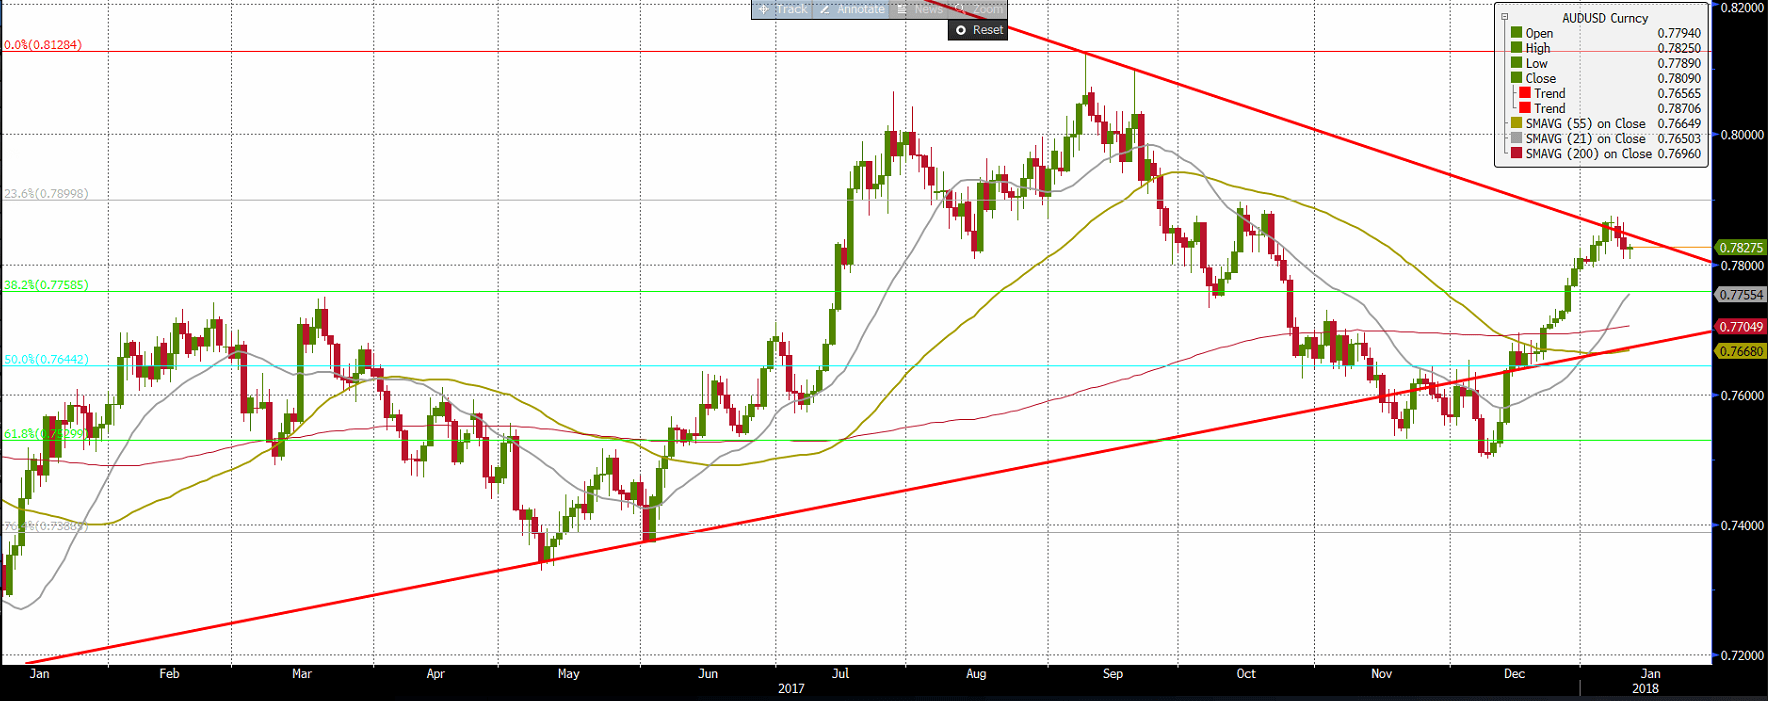
The pair found resistance against the medium term supply line that links lower highs. Beneath 0.78 it may test 0.77 and then its December low at 0.75. Above 0.7850 AUDUSD it could rally to 0.81, the bearish spikes made in September.
Author

ALB Team
ALB Forex Trading
ALB Research Department is the research department of ALB Forex Trading Ltd.


