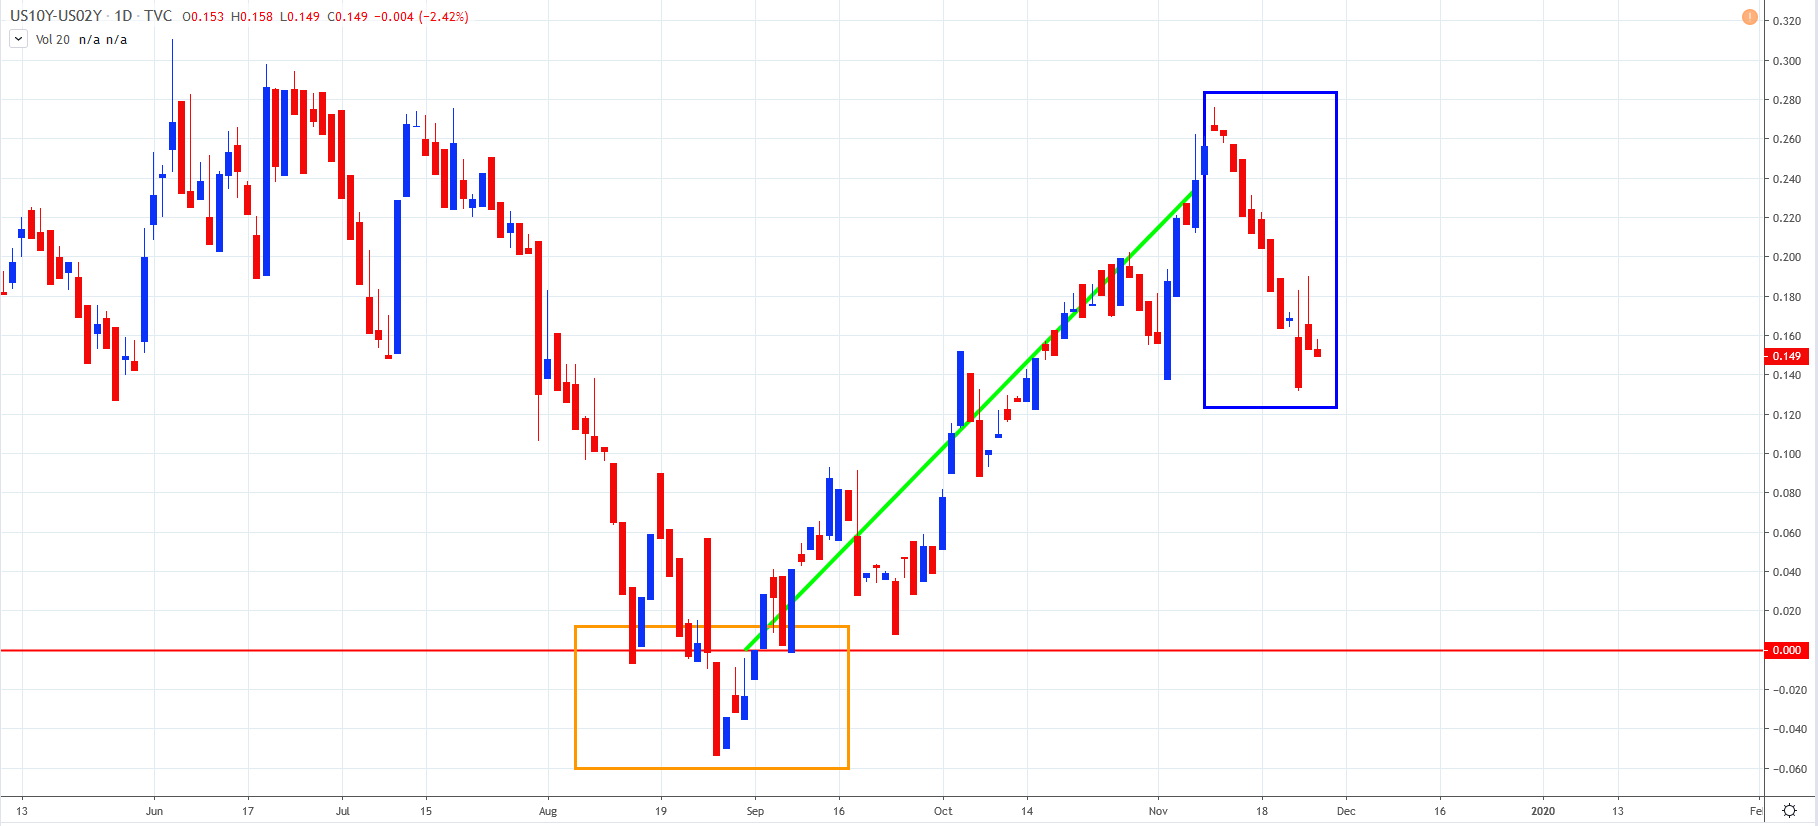
US 10/2s Yield Curve Flattens as Fed Pauses
The below is the daily chart of the 10/2s yield curve. The curve inverted into August (orange rectangle.) However, follow the Fed cutting rates in September and October, and after the cut in July, the yield curve began to steepen (green trendline). Lately, the Fed has adopted a pause policy with regards to its rates and the yield curve has begun to flatten again (blue rectangle). It is worth keeping an eye on just how flat the curve goes (does it re-invert?) as it generally reflects a cautionary outlook by market participants. This is interesting as the recent news regarding the trade dispute between the US and China has been good. Is the yield curve suggesting potential problems in this regard? We continue to monitor.
Past performance is not an indicator of future results.
CHART SOURCE: WWW.TRADINGVIEW.COM
Author

Russell Shor (MSTA, CFTe, MFTA) has an Honours Degree in Economics from the University of South Africa and holds the coveted Certified Financial Technician and Master of Financial Technical Analysis qualifications from the Interna


