Upside supply risks bullish for Brent crude price

Brent crude price has been advancing on rising Middle East tensions, risks to global supply while US demand foir gasoline is unusually high. Will the price continue advancing?
US Energy Information Administration reported that last week domestic crude supplies fell by more than analysts were expecting: 1.1 million barrels to 427.57 million. US stocks are close to the five-year average of about 420 million barrels. And the EIA reported that gasoline demand hit a record of 9.857 million barrels a day last week, up 584,000 barrels, strongest even for the peak vacation months of June, July and August. On global supply front there have been reports major oil producers may be targeting much higher oil prices with senior Saudi officials expressing their support for crude prices at around $80 and higher as the kingdom prepares for the IPO of Saudi Aramco. There are also concerns about Venezuela and Iran oil outputs on back of uncertainties about possible re-imposition of US sanction on Iran and arrest of two Chevron executives in Venezuela.
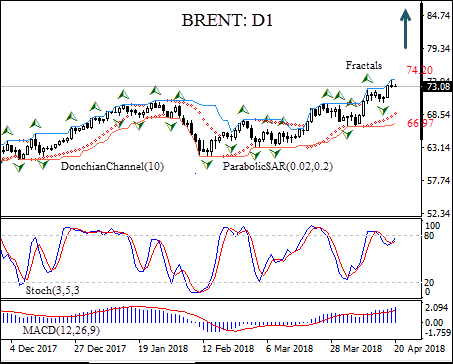
The BRENT is rising on the daily chart after hitting seventeen month low in June, 2017.
-
The Parabolic indicator gives a buy signal.
-
The Donchian channel signals uptrend: it is tilted up.
-
The MACD indicator is above the signal line and the gap is widening, which is a bullish signal.
-
The stochastic oscillator is rising but hasn’t breached into the overbought zone.
We believe the bullish momentum will continue after the price breaches above the upper Donchian bound at 74.20. This level can be used as an entry point for a pending order to buy. The stop loss can be placed below the lower Donchian bound at 66.97. After placing the order, the stop loss is to be moved every day to the next fractal low, following Parabolic signals. Thus, we are changing the probable profit/loss ratio to the breakeven point. If the price meets the stop loss level without reaching the order, we recommend cancelling the order: the market sustains internal changes which were not taken into account.
Technical Analysis Summary
|
Position |
Buy |
|
Buy stop |
Above 74.20 |
|
Stop loss |
Below 66.97 |
Want to get more free analytics? Open Demo Account now to get daily news and analytical materials.
Want to get more free analytics? Open Demo Account now to get daily news and analytical materials.
Author

Dmitry Lukashov
IFC Markets
Dimtry Lukashov is the senior analyst of IFC Markets. He started his professional career in the financial market as a trader interested in stocks and obligations.


