Upside Continues…again
US Dollar: March USD is Up at 95.760.
Energies: Feb '19 Crude is Up at 52.65.
Financials: The Mar 30 year bond is Down 9 ticks and trading at 144.24.
Indices: The Mar S&P 500 emini ES contract is 26 ticks Higher and trading at 2641.75.
Gold: The Feb Gold contract is trading Down at 1287.80. Gold is 45 ticks Lower than its close.
Initial Conclusion
This is not a correlated market. The dollar is Up+ and Crude is Up+ which is not normal but the 30 year Bond is trading Lower. The Financials should always correlate with the US dollar such that if the dollar is lower then bonds should follow and vice-versa. The S&P is Higher and Crude is trading Higher which is not correlated. Gold is trading Lower which is correlated with the US dollar trading Higher. I tend to believe that Gold has an inverse relationship with the US Dollar as when the US Dollar is down, Gold tends to rise in value and vice-versa. Think of it as a seesaw, when one is up the other should be down. I point this out to you to make you aware that when we don't have a correlated market, it means something is wrong. As traders you need to be aware of this and proceed with your eyes wide open.
At this hour all of Asia is trading Higher with the exception of the Indian Sensex exchange which is Lower at this time. Currently all of Europe is trading Higher.
Possible Challenges To Traders Today
-
FOMC Member Williams Speaks at 9:05 AM EST. This is major.
-
Capacity Utilization Rate is out at 9:15 AM EST. This is major.
-
Industrial Production is out at 9:15 AM EST. Major.
-
Prelim UoM Consumer Sentiment is out at 10 AM EST. Major.
-
Prelim UoM Inflation Expectations is out at 10 AM EST. This is major.
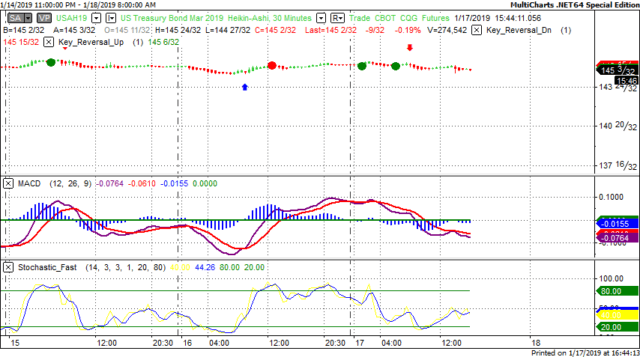
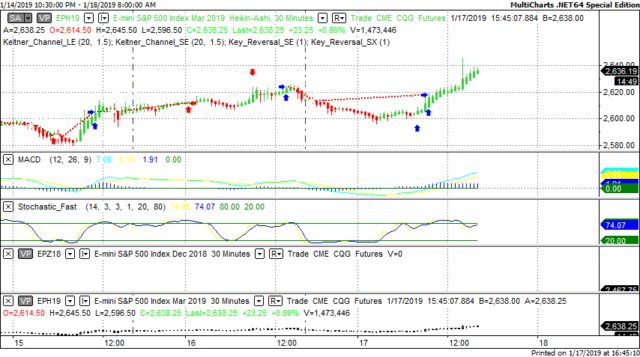
Treasuries
We've elected to switch gears a bit and show correlation between the 30 year bond (ZB) and The YM futures contract. The YM contract is the DJIA and the purpose is to show reverse correlation between the two instruments. Remember it's liken to a seesaw, when up goes up the other should go down and vice versa.
Yesterday the ZB made a major move at around 8 AM EST. The ZB hit a High at around that time and the YM hit a Low. If you look at the charts below ZB gave a signal at around 8 AM EST and the YM was moving Higher at the same time. Look at the charts below and you'll see a pattern for both assets. ZB hit a High at around 8 AM and the YM was moving Higher at the same time. These charts represent the newest version of MultiCharts and I've changed the timeframe to a 30 minute chart to display better. This represented a Long opportunity on the 30 year bond, as a trader you could have netted about 20 plus ticks per contract on this trade. Each tick is worth $31.25. Please note: the front month for the ZB contract is now March, 2019
Charts Courtesy of MultiCharts built on an AMP platform.
Bias
Yesterday we gave the markets a Downside bias as both the USD and the Bonds were trading Higher yesterday morning and this usually represents a Downside day. The markets had other ideas as the Dow gained 163 points and the other indices gained ground as well. Today we aren't dealing with a correlated market and our bias is Neutral.
Could this change? Of Course. Remember anything can happen in a volatile market.
Commentary
Yesterday the news was that the US is considering lifting tariffs on certain goods imported from China. The markets surged on this and remained in positive territory all session long. The Dow gained 163 points and the other indices gained ground as well. On Monday we celebrate Martin Luther King day and the markets are closed. We will be back on Tuesday, January 22nd.
Author

Nick Mastrandrea
Market Tea Leaves


