Upside bias = Upside day – Asia and Europe trading mainly higher [Video]
![Upside bias = Upside day – Asia and Europe trading mainly higher [Video]](https://editorial.fxstreet.com/images/Markets/Currencies/Majors/DollarIndex/billete-de-un-dolar-gm510323320-86203025_XtraLarge.jpg)
US Dollar: June USD is Down at 97.410.
Energies: Jul'20 Crude is Up at 37.48.
Financials: The Sept'20 30 year bond is Down 27 ticks and trading at 176.16.
Indices: The June S&P 500 emini ES contract is 50 ticks Higher and trading at 3089.50.
Gold: The Aug'20 Gold contract is trading Down at 1723.10. Gold is 105 ticks Lower than its close.
Initial Conclusion
This is not a correlated market. The dollar is Down- and Crude is Up+ which is normal and the 30 year Bond is trading Lower. The Financials should always correlate with the US dollar such that if the dollar is lower then bonds should follow and vice-versa. The S&P is Higher and Crude is trading Higher which is not correlated. Gold is trading Lower which is not correlated with the US dollar trading Down. I tend to believe that Gold has an inverse relationship with the US Dollar as when the US Dollar is down, Gold tends to rise in value and vice-versa. Think of it as a seesaw, when one is up the other should be down. I point this out to you to make you aware that when we don't have a correlated market, it means something is wrong. As traders you need to be aware of this and proceed with your eyes wide open.
At this time all of Asia is trading mainly Higher. Currently all of Europe is trading Higher as well.
Possible Challenges To Traders Today:
-
ADP Non-Farm Employment Change is out at 8:15 AM EST. This is Major.
-
Final Services PMI is out at 9:45 AM EST. This is not Major.
-
ISM Non-Manufacturing PMI is out at 10 AM EST. This is Major.
-
Factory Orders m/m is out at 10 AM EST. This is Major.
-
Crude Oil Inventories is out at 10:30 AM EST. This is Major.
Treasuries
We've elected to switch gears a bit and show correlation between the 30 year bond (ZB) and The S&P futures contract. The S&P contract is the Standard and Poor's and the purpose is to show reverse correlation between the two instruments. Remember it's liken to a seesaw, when up goes up the other should go down and vice versa.
Yesterday the ZB made it's move at around 10 AM EST. The ZB hit a High at around that time and the S&P moved Higher. If you look at the charts below ZB gave a signal at around 10 AM EST and the S&P moved Higher at around the same time. Look at the charts below and you'll see a pattern for both assets. ZB hit a High at around 10 AM EST and the S&P was moving Higher shortly thereafter. These charts represent the newest version of MultiCharts and I've changed the timeframe to a 15 minute chart to display better. This represented a Shorting opportunity on the 30 year bond, as a trader you could have netted about a dozen ticks per contract on this trade. Each tick is worth $31.25. Please note: the front month for the ZB is now June '20. The S&P contract is now June '20 as well. I've changed the format to Renko bars such that it may be more apparent and visible.
Charts Courtesy of MultiCharts built on an AMP platform
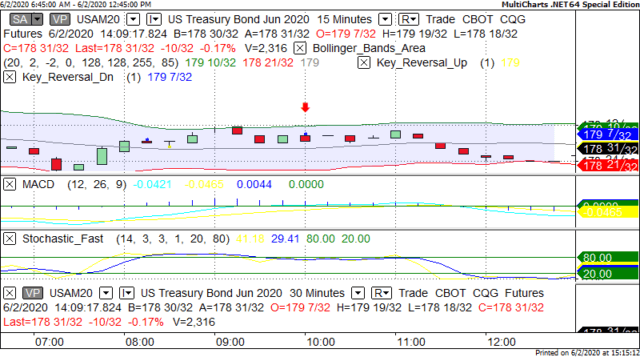
ZB - June 2020 - 6/2/20
-637267761514553734.png)
SP - June 2020 - 6/2/20
Bias
Yesterday we gave the markets an Upside bias as both the USD and the Bonds were trading Lower and this is usually indicative of an Upside day. The markets didn't disappoint as the Dow closed 268 points Higher and the other indices traded Higher as well. Today we aren't dealing with a correlated market and our bias is to the Upside.
Could this change? Of Course. Remember anything can happen in a volatile market.
Commentary
Yesterday morning we saw the USD and the Bonds trading Lower and this is generally a sign for an Upside day. Yesterday there wasn't much in the way of economic news to drive the markets. From our perspective we will just follow our rules of Market Correlation as it usually keeps us on the right side of the market, as it did yesterday.
Author

Nick Mastrandrea
Market Tea Leaves


