Upside Bias = Upside Day [Video]
![Upside Bias = Upside Day [Video]](https://editorial.fxstreet.com/images/Macroeconomics/CentralBanks/FED/the-federal-reserve-building-in-washington-dc-usa-67160227_XtraLarge.jpg)
US Dollar: Dec USD is Up at 98.085.
Energies: Nov '19 Crude is Down at 52.70.
Financials: The Dec 30 year bond is Up 23 ticks and trading at 160.21.
Indices: The Dec S&P 500 emini ES contract is 40 ticks Lower and trading at 2987.75.
Gold: The Dec Gold contract is trading Up at 1487.40. Gold is 39 ticks Higher than its close.
Initial Conclusion
This is not a correlated market. The dollar is Up+ and Crude is Down- which is normal and the 30 year Bond is trading Higher. The Financials should always correlate with the US dollar such that if the dollar is lower then bonds should follow and vice-versa. The S&P is Lower and Crude is trading Lower which is not correlated. Gold is trading Higher which is not correlated with the US dollar trading Down. I tend to believe that Gold has an inverse relationship with the US Dollar as when the US Dollar is down, Gold tends to rise in value and vice-versa. Think of it as a seesaw, when one is up the other should be down. I point this out to you to make you aware that when we don't have a correlated market, it means something is wrong. As traders you need to be aware of this and proceed with your eyes wide open.
At this time Asia is trading mainly Higher with the exception of the Shanghai and Sensex exchanges which are Lower. Currently all of Europe is trading Lower with the exception of the German Dax exchange which is fractionally Higher at this time.
Possible Challenges To Traders Today
- Retail Sales is out at 8:30 AM EST. This is major.
- Core Retail Sales is out at 8:30 AM. This is major.
- FOMC Member Evans Speaks at 9 AM EST. This is major.
- Business Inventories m/m is out at 10 AM EST. This is major.
- NAHB Housing Market Index is out at 10 AM EST. This is major.
- Beige Book is out at 2 PM EST. This is major.
- Federal Budget Balance is out at 2 PM EST. This is major.
- FOMC Member Brainard Speaks at 3 PM EST. This is major.
- TIC Long-Term Purchases is out at 4 PM. No impact on session.
Treasuries
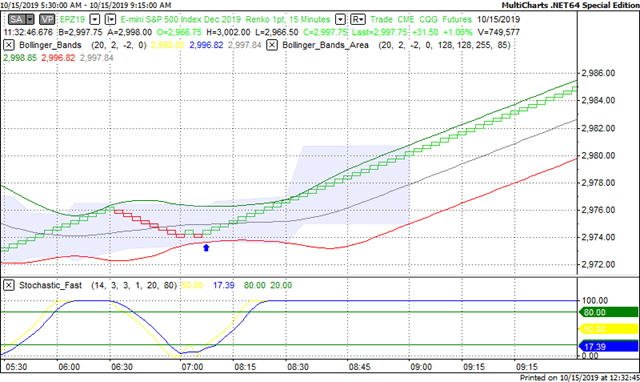
We've elected to switch gears a bit and show correlation between the 30 year bond (ZB) and The S&P futures contract. The S&P contract is the Standard and Poor's and the purpose is to show reverse correlation between the two instruments. Remember it's liken to a seesaw, when up goes up the other should go down and vice versa.
Yesterday the ZB made a major move at around 8 AM EST. The ZB hit a High at around that time and the S&P hit a Low. If you look at the charts below ZB gave a signal at around 8 AM EST and the S&P was moving Higher at the same time. Look at the charts below and you'll see a pattern for both assets. ZB hit a High at around 8 AM and the S&P was moving Higher at the same time. These charts represent the newest version of MultiCharts and I've changed the timeframe to a 15 minute chart to display better. This represented a Shorting opportunity on the 30 year bond, as a trader you could have netted about a dozen ticks per contract on this trade. Each tick is worth $31.25. Please note: the front month for the ZB is now December. The S&P contract is now at December as well and I've changed the format to Renko bars such that it may be more apparent and visible.
Charts Courtesy of MultiCharts built on an AMP platform
Bias
Yesterday we gave the markets an Upside bias as both the USD and the Bonds were trading Lower yesterday morning and this is generally indicative of an Upside Day. The markets didn't disappoint as the Dow gained 237 points and the other indices gained ground as well. Today we aren't dealing with a correlated market and our bias is to the Downside.
Could this change? Of Course. Remember anything can happen in a volatile market.
Commentary
Yesterday morning reading the market tea leaves wasn't as easy as we would like as the USD flip flopped between negative and positive territory. Ordinarily we would like to see clear signs of correlation but yesterday it wasn't that clear. We did believe that the USD would lose ground (as it eventually did). Today we have about 9 major economic reports with two FOMC members speaking so today will have its own set of challenges. From our point of view we will just stick to our rules of market correlation that has served us well.
Author

Nick Mastrandrea
Market Tea Leaves


