Job numbers weren't that dismal to the markets as all the indices rose and gained ground
US Dollar: March USD is Up at 97.135.
Energies: Feb'20 Crude is Up at 58.35.
Financials: The Mar'20 30 year bond is Up 4 ticks and trading at 157.12.
Indices: The March SP 500 emini ES contract is 18 ticks Lower and trading at 3285.25.
Gold: The Feb'20 Gold contract is trading Down at 1545.90. Gold is 47 ticks Lower than its close.
Initial Conclusion
This is not a correlated market. The dollar is Up+ and Crude is Up+ which is not normal and the 30 year Bond is trading Higher. The Financials should always correlate with the US dollar such that if the dollar is lower then bonds should follow and vice-versa. The S&P is Lower and Crude is trading Higher which is correlated. Gold is trading Lower which is correlated with the US dollar trading Up. I tend to believe that Gold has an inverse relationship with the US Dollar as when the US Dollar is down, Gold tends to rise in value and vice-versa. Think of it as a seesaw, when one is up the other should be down. I point this out to you to make you aware that when we don't have a correlated market, it means something is wrong. As traders you need to be aware of this and proceed with your eyes wide open.
At this time Asia is trading mainly Higher with the exception of the Shanghai and Hang Seng exchanges which are Lower. Currently all of Europe is trading Lower with the exception of the London exchange.
Possible Challenges To Traders Today:
-
NFIB Small Business Index is out at 6 AM EST. This is major.
-
CPI is out at 8:30 AM EST. This is Major.
-
Core CPI is out at 8:30 AM EST. This is Major.
-
FOMC Member Williams Speaks at 9 AM EST. This is Major.
-
IBD/TIPP Economic Optimism is out. This is Major.
Treasuries
We've elected to switch gears a bit and show correlation between the 30 year bond (ZB) and The S&P futures contract. The S&P contract is the Standard and Poor's and the purpose is to show reverse correlation between the two instruments. Remember it's liken to a seesaw, when up goes up the other should go down and vice versa.
Yesterday the ZB made a major move at around 8:30 AM EST. The ZB hit a High at around that time and the S&P moved Higher. If you look at the charts below ZB gave a signal at around 8:30 AM EST and the S&P moved Higher at the same time. Look at the charts below and you'll see a pattern for both assets. ZB hit a High at around 8:30 AM and the S&P was moving Higher shortly thereafter. These charts represent the newest version of MultiCharts and I've changed the timeframe to a 15 minute chart to display better. This represented a Shorting opportunity on the 30 year bond, as a trader you could have netted about 10 ticks per contract on this trade. Each tick is worth $31.25. Please note: the front month for the ZB is now March '20. The S&P contract is also March '20. I've changed the format to Renko bars such that it may be more apparent and visible.
Charts Courtesy of MultiCharts built on an AMP platform
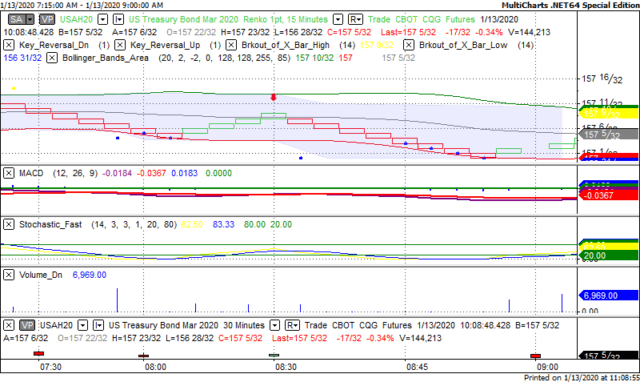
ZB - March, 2020 - 1/13/20
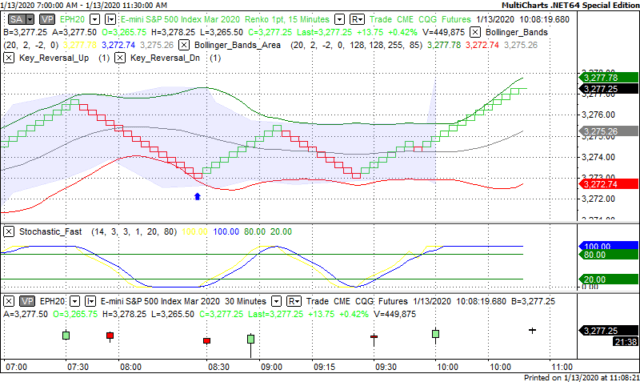
SP March 2020- 1/13/20
Bias
Yesterday we gave the markets an Upside bias as the Bonds, Gold and Crude were all trading lower and this is indicative of an Upside day, hence the Upside bias. The markets didn't disappoint as the Dow gained 84 points and the other indices rose as well. Today we aren't dealing with a correlated market and our bias is to the Downside.
Could this change? Of Course. Remember anything can happen in a volatile market.
Commentary
So it seems that the job numbers weren't that dismal to the markets as all the indices rose and gained ground yesterday. Today we have more economic news than we did yesterday but the major reports today concern CPI and Core CPI as this affects the prime rate and in turn interest rates charged by the banks for consumer spending. We also have an FOMC member speaking at 9 AM EST immediately following the CPI numbers that are due out at 8:30 AM.
Author

Nick Mastrandrea
Market Tea Leaves


