Good Morning Traders,

As of this writing 4 AM EST, here’s what we see:

US Dollar: Sept. USD is Down at 91.630.

Energies: Nov Crude is Up at 50.57.

Financials: The Dec 30 year bond is Up 1 tick and trading at 154.12.

Indices: The Dec S&P 500 emini ES contract is 1 tick Higher and trading at 2502.75.

Gold: The Dec gold contract is trading Up at 1311.90.  Gold is 10 ticks Higher than its close.

Initial Conclusion

This is not a correlated market.  The dollar is Down- and Crude is Up+ which is normal but the 30 year Bond is trading Higher.  The Financials should always correlate with the US dollar such that if the dollar is lower then bonds should follow and vice-versa. The indices are Mixed and Crude is trading Up+ which is not correlated. Gold is trading Up+ which is correlated with the US dollar trading Down-.   I tend to believe that Gold has an inverse relationship with the US Dollar as when the US Dollar is down, Gold tends to rise in value and vice-versa. Think of it as a seesaw, when one is up the other should be down. I point this out to you to make you aware that when we don’t have a correlated market, it means something is wrong. As traders you need to be aware of this and proceed with your eyes wide open.

At this hour all of Asia is trading Mixed with half the exchanges Higher and the other half Lower.  As of this writing Europe is also trading Mixed.

Possible Challenges To Traders Today

  •  Building Permits are out at 8:30 AM EST.  This is major.

  •   Current Account is out at 8:30 AM EST.  This is major.

  •   Housing Starts is out at 8:30 AM EST.  This is major.

  •   Import Prices m/m is out at 8:30 AM.  This is not major.


Treasuries

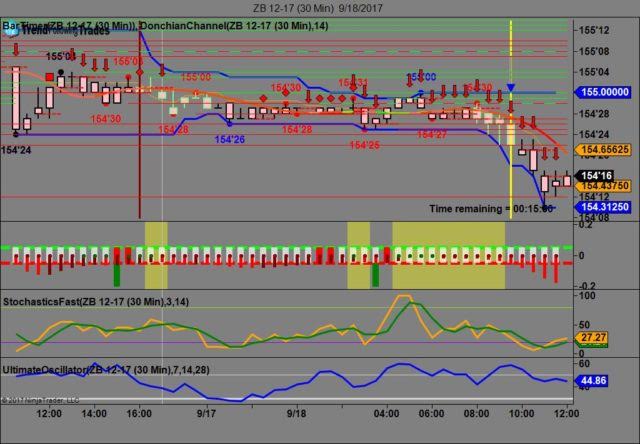
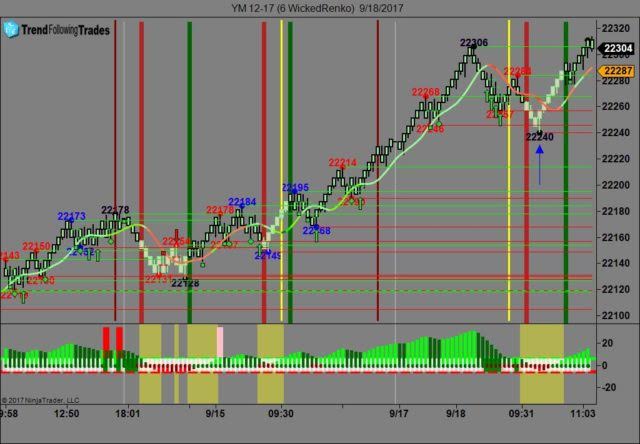
We’ve elected to switch gears a bit and show correlation between the 30 year bond (ZB) and The YM futures contract.  The YM contract is the DJIA and the purpose is to show reverse correlation between the two instruments.  Remember it’s liken to a seesaw, when up goes up the other should go down and vice versa.

On Friday the ZB made it’s move at around 9:30 AM EST right at the opening bell.  The ZB hit a High at around that time and the YM hit a Low.  If you look at the charts below ZB gave a signal at around 9:30 AM EST and the YM was moving Higher at the same time. Look at the charts below and you’ll see a pattern for both assets. ZB hit a High at around 9:30 AM and the YM hit a Low.  These charts represent the newest version of Trend Following Trades and I’ve changed the timeframe to a 30 minute chart to display better.  This represented a shorting opportunity on the 30 year bond, as a trader you could have netted about 15 plus ticks per contract on this trade.  Each tick is worth $31.25.  We added a Donchian Channel to the charts to show the signals more clearly.  Please note that the front month for the ZB and the YM contract is now December, 2017.

Charts Courtesy of Trend Following Trades built on a NinjaTrader platform.

ZB


YM

Bias

Yesterday we called for an Upside bias as both Gold and the Bonds were trading Lower Monday morning and this usually reflects an Upside day.  The markets didn’t disappoint as the Dow rose 63 points and the other indices gained ground as well.  We aren’t dealing with a correlated market and our bias is Neutral.

Could this change? Of Course.  Remember anything can happen in a volatile market. 

Commentary

Yesterday our bias was to the Upside even though the NAHB Housing numbers came in lower than expected.  NAHB came in at 64 versus an expectation of 67.  The markets however didn’t disappoint and rose higher.  Today we have more economic news on the horizon and also have President Trump speaking and addressing the United Nations today.  Tomorrow we have the FOMC Meeting…

Trading performance displayed herein is hypothetical. The following Commodity Futures Trading Commission (CFTC) disclaimer should be noted.

Hypothetical performance results have many inherent limitations, some of which are described below. No representation is being made that any account will or is likely to achieve profits or losses similar to those shown.

In fact, there are frequently sharp differences between hypothetical performance results and the actual results subsequently achieved by any particular trading program. One of the limitations of hypothetical performance trading results is that they are generally prepared with the benefit of hindsight.

In addition, hypothetical trading does not involve financial risk, and no hypothetical trading record can completely account for the impact of financial risk in actual trading. For example, the ability to withstand losses or to adhere to a particular trading program in spite of trading losses are material points which can also adversely affect actual trading results.

There are numerous other factors related to the markets in general or to the implementation of any specific trading program which cannot be fully accounted for in the preparation of hypothetical performance results and all of which can adversely affect actual trading results.

Trading in the commodities markets involves substantial risk and YOU CAN LOSE A LOT OF MONEY, and thus is not appropriate for everyone. You should carefully consider your financial condition before trading in these markets, and only risk capital should be used.

In addition, these markets are often liquid, making it difficult to execute orders at desired prices. Also, during periods of extreme volatility, trading in these markets may be halted due to so-called “circuit breakers” put in place by the CME to alleviate such volatility. In the event of a trading halt, it may be difficult or impossible to exit a losing position.

Recommended Content


Recommended Content

Editors’ Picks

EUR/USD holds gains near 1.0650 amid risk reset

EUR/USD holds gains near 1.0650 amid risk reset

EUR/USD is holding onto its recovery mode near 1.0650 in European trading on Friday. A recovery in risk sentiment is helping the pair, as the safe-haven US Dollar pares gains. Earlier today, reports of an Israeli strike inside Iran spooked markets. 

EUR/USD News

GBP/USD recovers toward 1.2450 after UK Retail Sales data

GBP/USD recovers toward 1.2450 after UK Retail Sales data

GBP/USD is rebounding toward 1.2450 in early Europe on Friday, having tested 1.2400 after the UK Retail Sales volumes stagnated again in March, The pair recovers in tandem with risk sentiment, as traders take account of the likely Israel's missile strikes on Iran. 

GBP/USD News

Gold price defends gains below $2,400 as geopolitical risks linger

Gold price defends gains below $2,400 as geopolitical risks linger

Gold price is trading below $2,400 in European trading on Friday, holding its retreat from a fresh five-day high of $2,418. Despite the pullback, Gold price remains on track to book the fifth weekly gain in a row, supported by lingering Middle East geopolitical risks.

Gold News

Bitcoin Weekly Forecast: BTC post-halving rally could be partially priced in Premium

Bitcoin Weekly Forecast: BTC post-halving rally could be partially priced in

Bitcoin price shows no signs of directional bias while it holds above  $60,000. The fourth BTC halving is partially priced in, according to Deutsche Bank’s research. 

Read more

Geopolitics once again take centre stage, as UK Retail Sales wither

Geopolitics once again take centre stage, as UK Retail Sales wither

Nearly a week to the day when Iran sent drones and missiles into Israel, Israel has retaliated and sent a missile into Iran. The initial reports caused a large uptick in the oil price.

Read more

Majors

Cryptocurrencies

Signatures