Upside bias – An upside day

USD: Sept '25 is Down at 96.645.
Energies: Oct '25 Crude is Up at 63.39.
Financials: The Dec '25 30 Year T-Bond is Lower by 3 ticks and trading at 117.24.
Indices: The Sep '25 S&P 500 emini ES contract is 42 ticks Higher and trading at 6632.50.
Gold: The Dec'25 Gold contract is trading Up at 3729.70.
Initial conclusion
This is not a correlated market. The USD is Down and Crude is Up which is normal, but the 30 Year T-Bond is trading Higher. The Financials should always correlate with the US dollar such that if the dollar is Higher, then the bonds should follow and vice-versa. The S&P is Higher and Crude is trading Higher which is not correlated. Gold is trading Higher which is correlated with the US dollar trading Down. I tend to believe that Gold has an inverse relationship with the US Dollar as when the US Dollar is down, Gold tends to rise in value and vice-versa. Think of it as a seesaw, when one is up the other should be down. I point this out to you to make you aware that when we don't have a correlated market, it means something is wrong. As traders you need to be aware of this and proceed with your eyes wide open. Asia traded Higher except the Hang Seng exchange. Currently all of Europe is trading Lower.
Possible challenges to traders
-
Core Retail Sales is out at 8:30 AM EST. This is Major.
-
Retail Sales is out at 8:30 AM EST. This is Major.
-
Import Prices m/m is out at 8:30 AM EST. This is Major.
-
Capacity Utilization Rate is out at 9:15 AM EST. This is Major.
-
Industrial Production m/m is out at 9:15 AM EST. This is Major.
-
Business Inventories m/m is out at 10 AM EST. This is Major.
-
NAHB Housing Market Index is out at 10 AM EST. This is Major.
Traders, please note that we've changed the Bond instrument from the 10 Year (ZN) to the 2 Year (ZT). They work exactly the same.
We've elected to switch gears a bit and show correlation between the 2-year Treasury notes (ZT) and the S&P futures contract. The YM contract is the Dow Jones Industrial Average, and the purpose is to show reverse correlation between the two instruments. Remember it's likened to a seesaw, when up goes up the other should go down and vice versa.
Yesterday the ZT dived Lower at around 8:30 AM EST with no data pending. The Dow climbed Higher at the same time. Look at the charts below and you'll see a pattern for both assets. The Dow climbed Higher at around 8:30 AM EST and the ZT dived Lower at around the same time. These charts represent the newest version of Bar Charts, and I've changed the timeframe to a 15-minute chart to display better. This represented a Short opportunity on the 2-year note, as a trader you could have netted about a dozen ticks per contract on this trade. Each tick is worth $6.25. Please note: the front month for ZT is now Dec '25 and the Dow is still Sep '25. I've changed the format to filled Candlesticks (not hollow) such that it may be more apparent and visible.
Charts courtesy of BarCharts
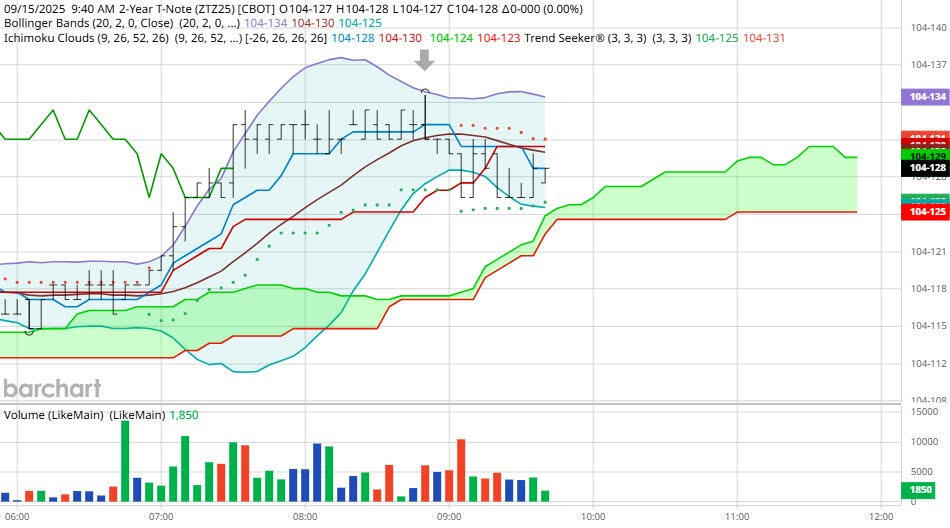
ZT -Sep 25 - 9/15/25
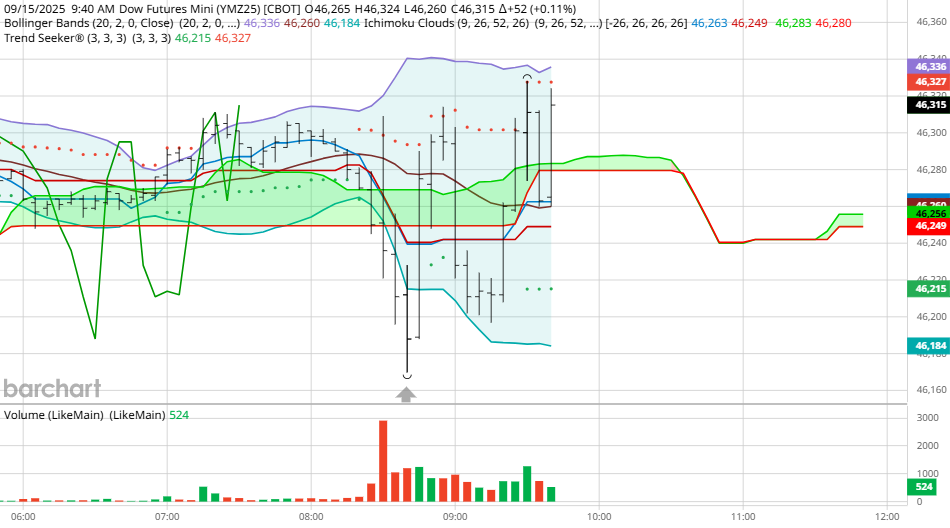
Dow - Sep 2025- 9/15/25
Bias
Yesterday we predicted an Upside Day, and the markets didn't disappoint. The Dow gained 49 points, and the other indices gained ground as well. Today unlike yesterday we have much more in the way of economic news. We aren't dealing with a corelated market, and our bias is Neutral or Mixed.
Could this change? Of Course. Remember anything can happen in a volatile market.
Commentary
Yesterday we once again saw the phenomena of the markets rising with not too stellar eco news. The Empire State Manufacturing Index wasn't stellar and didn't meet expectation, yet the markets rose with traders thinking that the Fed will lower rates. That may yet be the case, but time will tell. Want to learn Market Correlation and determine market direction hours before the Opening Bell?
Author

Nick Mastrandrea
Market Tea Leaves


