Upside Bias = An Upside Day

Good Morning Traders,
As of this writing 4 AM EST, here’s what we see:
US Dollar: Jun. USD is Down at 97.520.
Energies: Jun Crude is Up at 50.06.
Financials: The June 30 year bond is Down 1 tick and trading at 153.26.
Indices: The June S&P 500 emini ES contract is 7 ticks Higher and trading at 2365.25.
Gold: The June gold contract is trading Down at 1250.40. Gold is 24 ticks Lower than its close.
Initial Conclusion
This is not a correlated market. The dollar is Down- and crude is Up+ which is normal and the 30 year bond is trading Lower. The Financials should always correlate with the US dollar such that if the dollar is lower then bonds should follow and vice-versa. The indices are Up+ and Crude is trading Up+ which is not correlated. Gold is trading Down- which is not correlated with the US dollar trading Down-. I tend to believe that Gold has an inverse relationship with the US Dollar as when the US Dollar is down, Gold tends to rise in value and vice-versa. Think of it as a seesaw, when one is up the other should be down. I point this out to you to make you aware that when we don’t have a correlated market, it means something is wrong. As traders you need to be aware of this and proceed with your eyes wide open.
At this hour all of Asia is trading mixed with half the exchanges higher and the other half lower. As of this writing all of Europe is trading higher.
Possible Challenges To Traders Today
– No major economic news to speak of.
– Lack of major economic news.
Treasuries
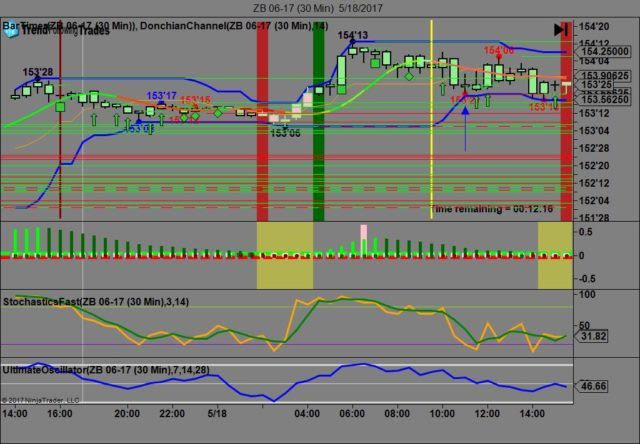
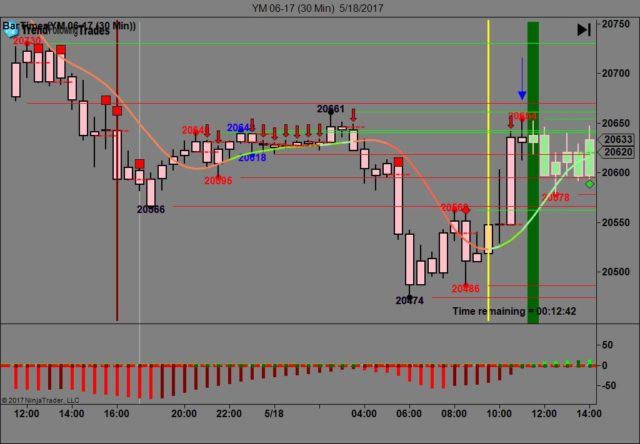
We’ve elected to switch gears a bit and show correlation between the 30 year bond (ZB) and The YM futures contract. The YM contract is the DJIA and the purpose is to show reverse correlation between the two instruments. Remember it’s liken to a seesaw, when up goes up the other should go down and vice versa.
Yesterday the ZB made it’s move at around 11 AM EST with no real economic news in sight. The ZB hit a low at around that time and the YM hit a high. If you look at the charts below ZB gave a signal at around 11 AM and the YM was moving lower at the same time. Look at the charts below and you’ll see a pattern for both assets. ZB hit a low at around 11 AM and the YM hit a high. These charts represent the newest version of Trend Following Trades and I’ve changed the timeframe to a 30 minute chart to display better. This represented a long opportunity on the 30 year bond, as a trader you could have netted about 15 ticks per contract on this trade. Each tick is worth $31.25. We added a Donchian Channel to the charts to show the signals more clearly.
Charts Courtesy of Trend Following Trades built on a NinjaTrader platform Click on an image to enlarge it.
Bias
Yesterday we gave the markets an upside bias as both the Bonds and Gold were trading lower yesterday morning and this usually signifies an upside day. The markets didn’t disappoint as the Dow traded up 56 points and the other indices traded higher as well. Today we aren’t dealing with a correlated market and our bias is neutral.
Could this change? Of Course. Remember anything can happen in a volatile market.
Commentary
Yesterday the economic news reported was mainly positive. Unemployment Claims came in at 232K versus 240K expected and the Philly Fed Manufacturing Index came in better than expected as well. From our point of view all we did was to follow our rules of Market Correlation which told us that the markets would go higher yesterday and they did. Today we have no economic news to speak of so the question of the day is can Trump lay low for today and not cause a controversy? Only time will tell.
Author

Nick Mastrandrea
Market Tea Leaves


