Up, Up and Away….

US Dollar: Dec. USD is Up at 96.740.
Energies: Jan '19 Crude is Down at 49.59.
Financials: The Dec 30 year bond is Up 17 ticks and trading at 140.15.
Indices: The Dec S&P 500 emini ES contract is 18 ticks Lower and trading at 2737.00.
Gold: The Dec Gold contract is trading Up at 1224.90. Gold is 13 ticks Higher than its close.
Initial Conclusion
This is not a correlated market. The dollar is Up+ and Crude is Down- which is normal and the 30 year Bond is trading Higher. The Financials should always correlate with the US dollar such that if the dollar is lower then bonds should follow and vice-versa. The S&P is Lower and Crude is trading Lower which is not correlated. Gold is trading Up+ which is not correlated with the US dollar trading Higher. I tend to believe that Gold has an inverse relationship with the US Dollar as when the US Dollar is down, Gold tends to rise in value and vice-versa. Think of it as a seesaw, when one is up the other should be down. I point this out to you to make you aware that when we don't have a correlated market, it means something is wrong. As traders you need to be aware of this and proceed with your eyes wide open.
At this hour Asia is trading mainly Higher with the exception of the Hang Seng and Shanghai exchanges which are Lower. At this time all of Europe is trading Higher.
Possible Challenges To Traders Today
-
Core PCE Price Index is out at 8:30 AM. This is major.
-
Personal Spending is out at 8:30 AM EST. This is major.
-
Personal Income is out at 8:30 AM. This is major.
-
Unemployment Claims are out at 8:30 AM. This is major.
-
Pending Home Sales are out at 10 AM EST. This is major.
-
Natural Gas Storage is out at 10:30 AM EST. This is major.
-
FOMC Meeting Minutes are out at 2 PM EST. This is major.
Treasuries
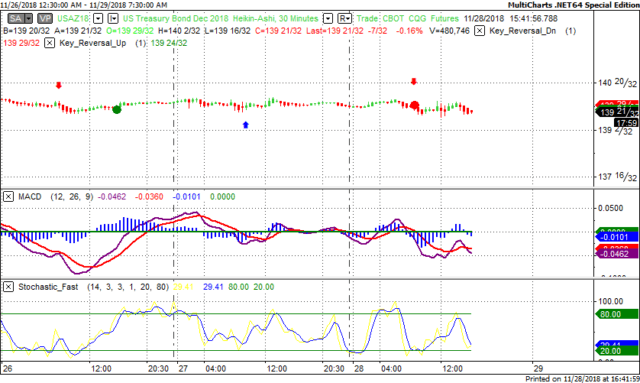
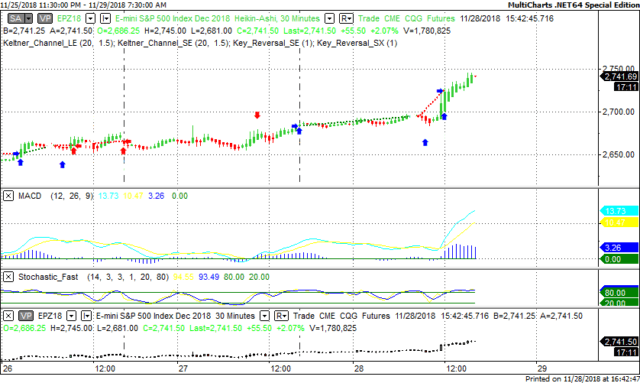
We've elected to switch gears a bit and show correlation between the 30 year bond (ZB) and The YM futures contract. The YM contract is the DJIA and the purpose is to show reverse correlation between the two instruments. Remember it's liken to a seesaw, when up goes up the other should go down and vice versa.
Yesterday the ZB made it's move at around 8:30 AM EST. The ZB hit a High at around that time and the YM hit a Low. If you look at the charts below ZB gave a signal at around 8:30 AM EST and the YM was moving Higher at the same time. Look at the charts below and you'll see a pattern for both assets. ZB hit a High at around 8:30 AM and the YM was moving Higher at the same time. These charts represent the newest version of MultiCharts and I've changed the timeframe to a 30 minute chart to display better. This represented a Shorting opportunity on the 30 year bond, as a trader you could have netted about a dozen ticks per contract on this trade. Each tick is worth $31.25.
Charts Courtesy of MultiCharts built on an AMP platform.
Bias
Yesterday we gave the markets a Neutral as the indices lacked direction Wednesday morning and as such the Neutral bias. The Dow gained a whopping 618 points and the other indices gained ground as well. Today we aren't dealing with a correlated market and our bias is to the Downside.
Could this change? Of Course. Remember anything can happen in a volatile market.
Commentary
Yesterday we gave the markets a Neutral bias because all the instruments we track were all pointed Higher and whenever you have a situation whereby all instruments are pointed either Higher or conversely Lower; there is no correlation thus the Neutral bias. The economic news reported was not spectacular as neither GDP or New Home Sales beat expectations but come midday Fed Chair Powell spoke and the markets took his comments as being more dovish in nature. Whether this is true or not only time will tell.....
Author

Nick Mastrandrea
Market Tea Leaves


