Up is still up

USD: Sep '23 is Down at 104.625.
Energies: Oct '23 Crude is Up at 91.37.
Financials: The Dec '23 30 Year T-Bond is Up 2 ticks and trading at 118.27.
Indices: The Dec '23 S&P 500 Emini ES contract is 24 ticks Higher and trading at 4507.50.
Gold: The Dec'23 Gold contract is trading Up at 1957.30. Gold is 39 ticks Higher than its close.
Initial conclusion
This is not a correlated market. The USD is Down and Crude is Up which is normal, but the 30 Year T-Bond is trading Higher. The Financials should always correlate with the US dollar such that if the dollar is Higher, then the bonds should follow and vice-versa. The S&P is Higher, and Crude is trading Higher which is not correlated. Gold is trading Higher which is correlated with the US dollar trading Down. I tend to believe that Gold has an inverse relationship with the US Dollar as when the US Dollar is down, Gold tends to rise in value and vice-versa. Think of it as a seesaw, when one is up the other should be down. I point this out to you to make you aware that when we don't have a correlated market, it means something is wrong. As traders you need to be aware of this and proceed with your eyes wide open. Asia is trading mainly Lower with the exception of the Hang Seng exchange which is Higher. Currently all of Europe is trading Higher with the exception of the Dax exchange which is fractionally Lower.
Possible challenges to traders
-
Building Permits is out at 8:30 AM EST. This is Major.
-
Housing Starts is out at 8:30 AM EST. This is Major.
Treasuries
Traders, please note that we've changed the Bond instrument from the 30 year (ZB) to the 10 year (ZN). They work exactly the same.
We've elected to switch gears a bit and show correlation between the 10-year bond (ZN) and the S&P futures contract. The S&P contract is the Standard and Poor's, and the purpose is to show reverse correlation between the two instruments. Remember it's likened to a seesaw, when up goes up the other should go down and vice versa.
Yesterday the ZN migrated Higher at around 9 AM EST as the S&P hit a High at around the same time. If you look at the charts below the S&P gave a signal at around 9 AM and the ZN started its Upward migration. Look at the charts below and you'll see a pattern for both assets. S&P hit a High at around 9 AM and migrated Lower. These charts represent the newest version of MultiCharts and I've changed the timeframe to a 15-minute chart to display better. This represented a Long opportunity on the 10-year note, as a trader you could have netted about a dozen plus ticks per contract on this trade. Each tick is worth $15.625. Please note: the front month for the ZN is now Dec '23. The S&P contract is now Dec' 23. I've changed the format to filled Candlesticks (not hollow) such that it may be more apparent and visible.
Charts courtesy of MultiCharts built on an AMP platform
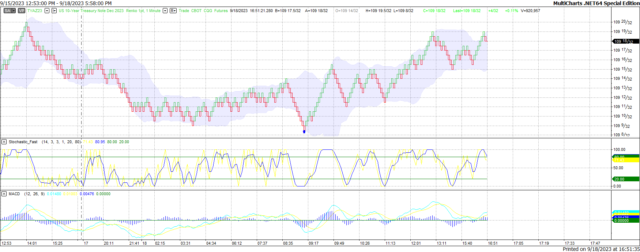
ZN - Dec 2023 - 9/18/23
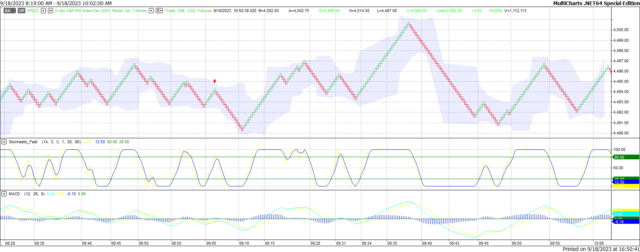
S&P - Dec 2023 - 9/18/23
Bias
Yesterday, we gave the markets an Upside bias as both the USD and the Bonds were trading Lower Monday morning, and this usually represents an Upside Day. The markets did cooperate although on a limited scale. The Dow gained 6 points, the S&P gained 3 and the Nasdaq gained 2. However small that is, Up is still Up. Today we aren't dealing with a correlated market and our bias is to the Upside.
Could this change? Of Course. Remember anything can happen in a volatile market.
Commentary
Yesterday the news of the day seemed to be the hostage release in Iran but the UAW auto workers union is still on strike and no deal has as of yet been made between the two parties. Unfortunately, this could drag out quite a bit longer even though it was announced that some favorable talks were made over the weekend. The UAW could drag other plants in on the strike from the Big Three automakers and drag it out even longer. It is our hope that this doesn't happen but as with the markets in general anything can happen in a volatile market. Today we have Building Permits and Housing Starts; both of which are major and proven market movers. We hope this will move the markets in an Upward direction.
Author

Nick Mastrandrea
Market Tea Leaves


