Happy Thanksgiving: Up down

The USD is following the textbook patterns as we saw USD buying from corporates Monday and Tuesday and as that fades, the real money USD sellers have taken control. In theory, today still has some potential for a bit more corporate USD buying, but my impression is that they are 95% done.
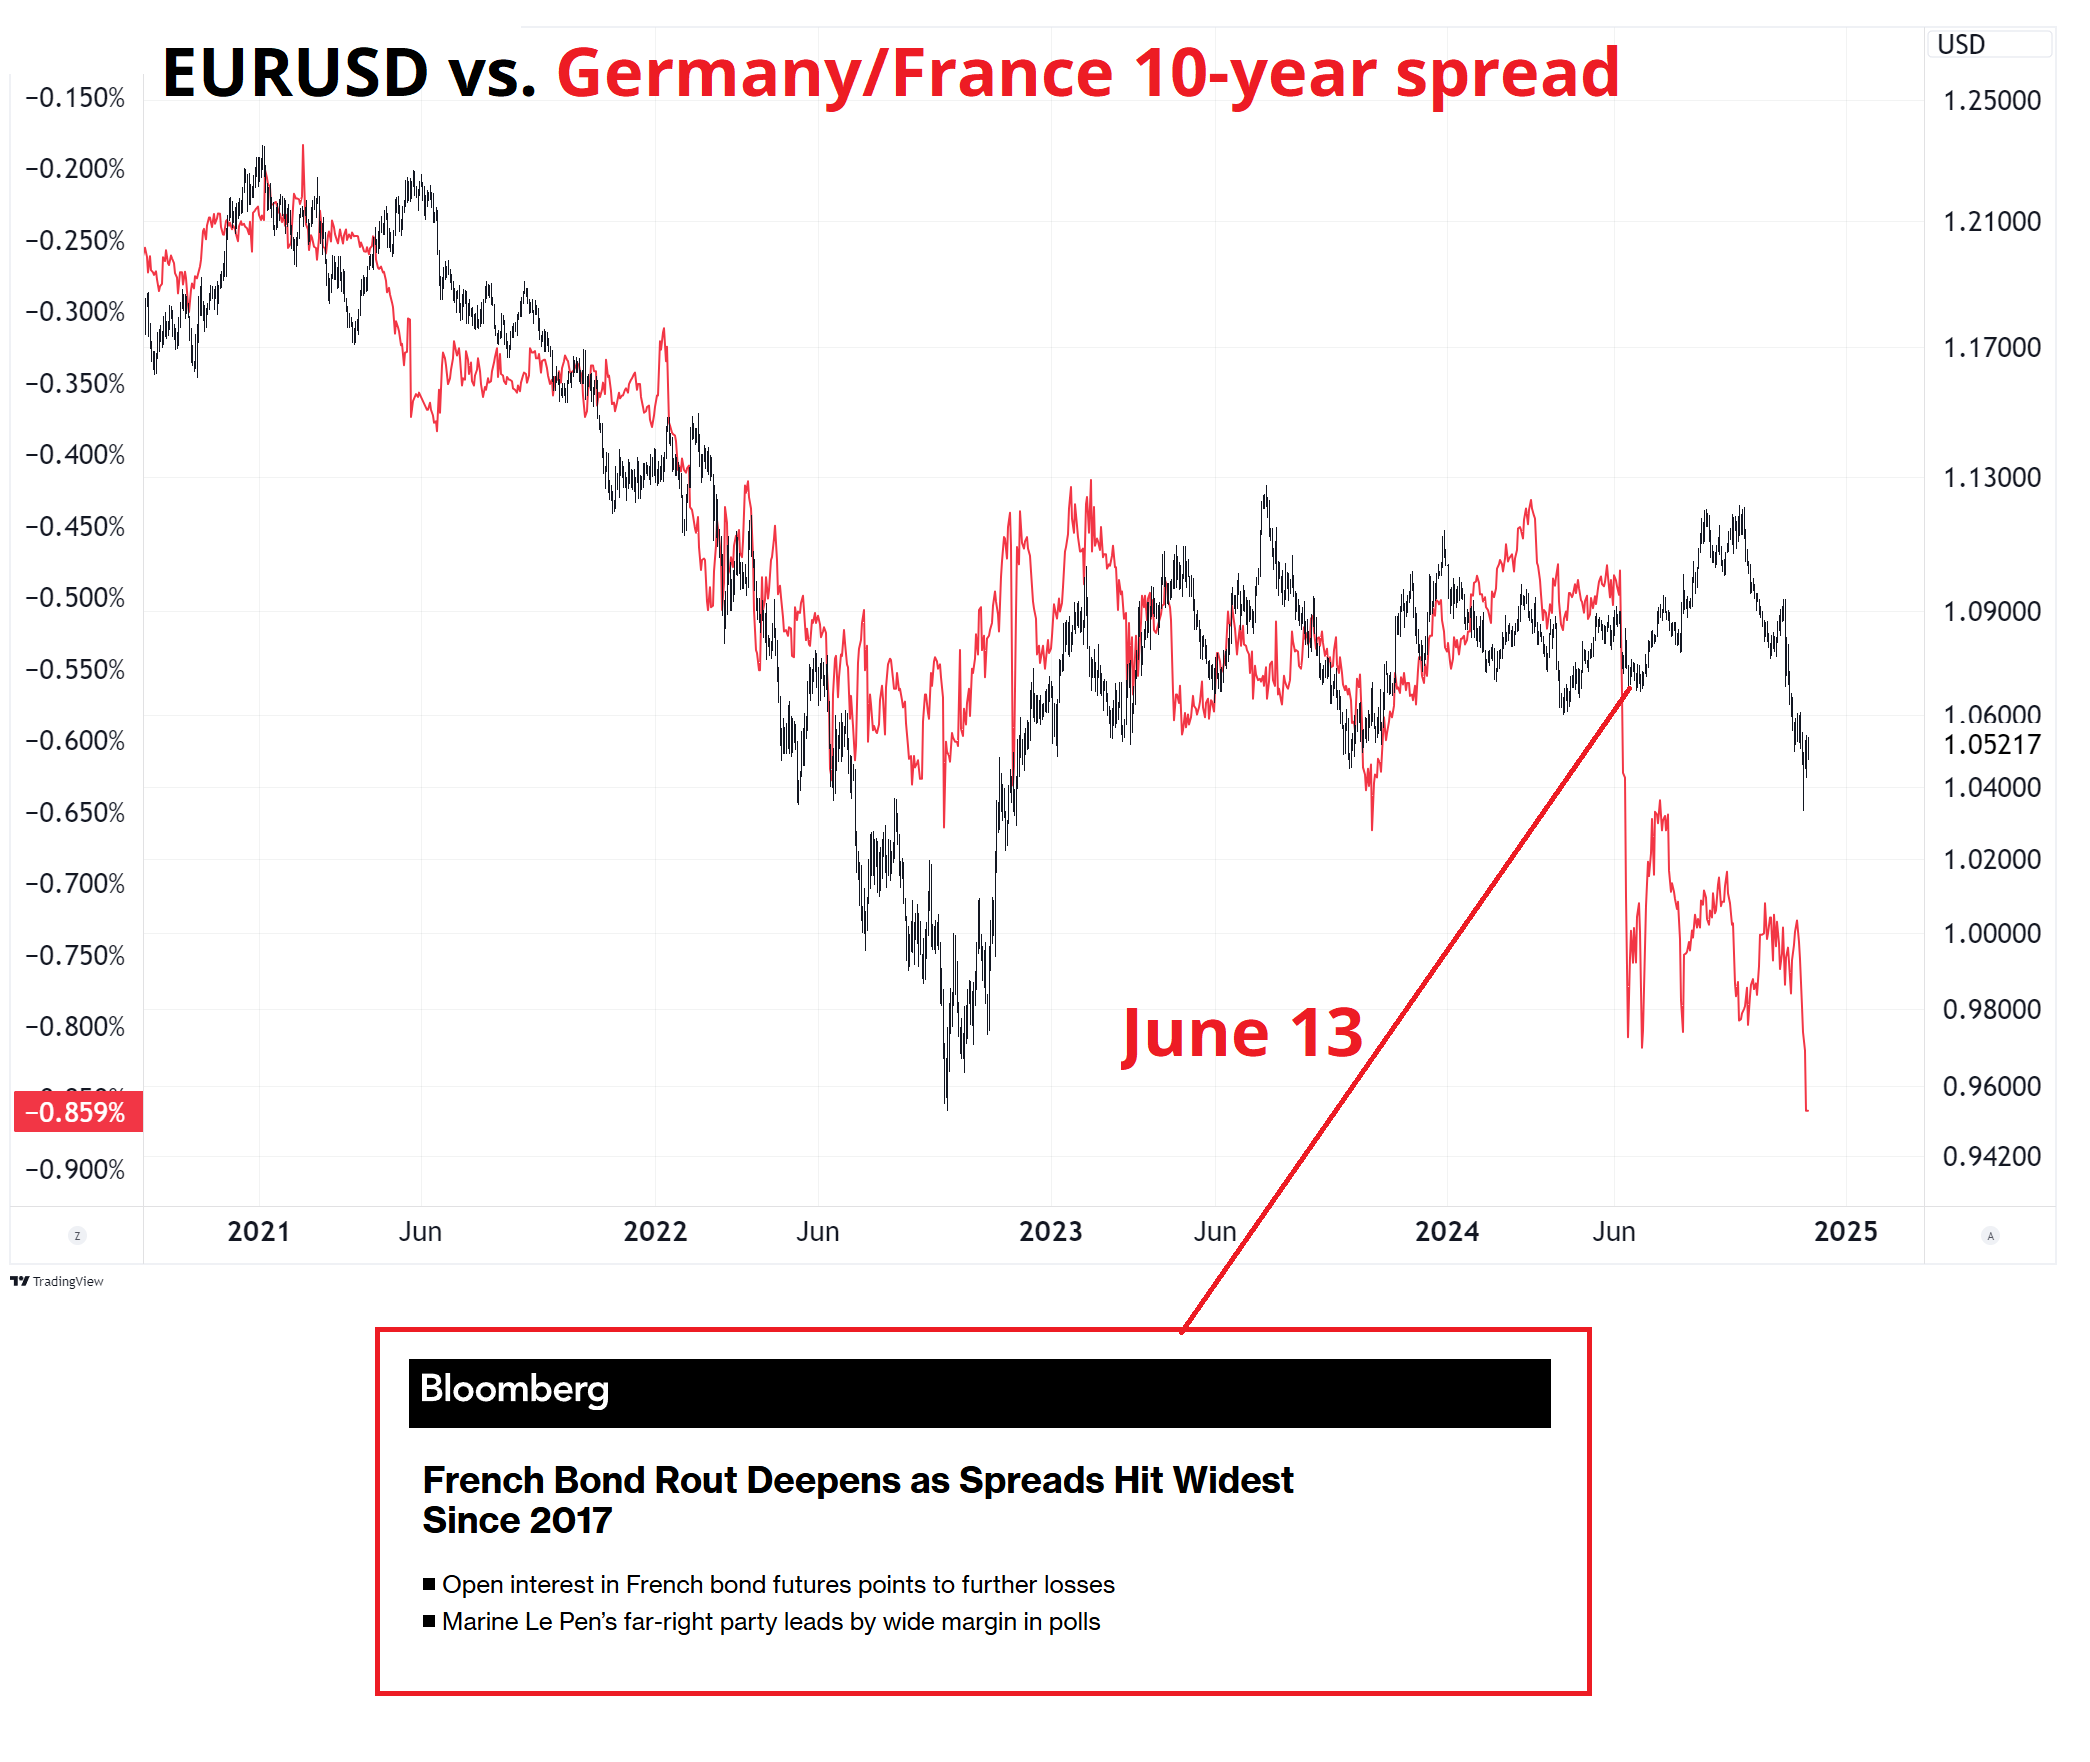
From here, it looks like we are set to consolidate and/or challenge the key resistance at 1.0590/00 in EURUSD. As much discussed, there are still many crosswinds for euro with short positioning extreme and seasonality turning bullish as the data flow is horrendous and French yields widen aggressively.
I find it interesting to see how well Germany/France spreads have tracked EURUSD throughout the post-COVID cycle. That said, other than some selling of OATs, I am not really sure how important the French story is for the price of EUR. In fact, when people got really excited about France widening in June 2024, that was the low in EURUSD. Widening spreads definitely are not bullish EUR in themselves, but short EUR on the back of France politics is unlikely to be a useful hypothesis.
Yesterday I showed how EURCHF tends to sell off pretty hard into the end of the month. I was curious whether there is mean reversion on the 1st day of the month as the repatriation flow dissipates. The answer is yes. The effect is not huge, but it is augmented by the fact that EURCHF went from 1.60 to 0.9300 in the period I studied (2000 to now) and so to find a bullish day in that sample is actually kind of impressive.
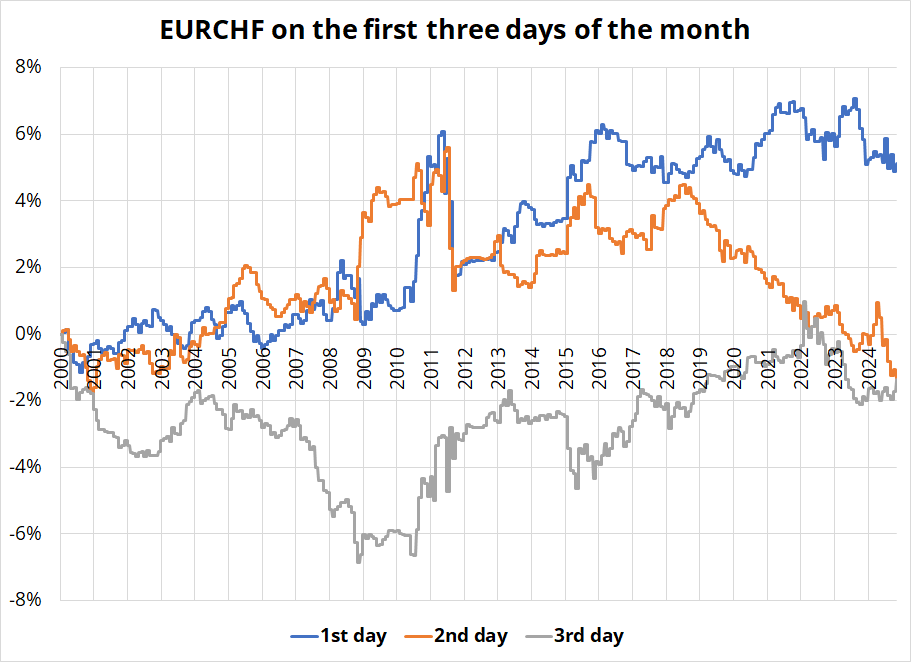
When you’re doing backtests like this, it’s always important to keep in mind whether there is a significant trend component to your data. For example, you often see backtests in equities that will say something like: When S&P is up 20% on the year in November, it tends to rally in December, 70% of the time. Is that good? Or is that just what it always does? Just about every initial condition you can test will show positive forward returns for equities.
This EURCHF is micro timescale stuff, and I know many readers are global macro with a multiweek time horizon. The thing is, no matter how long or short your time horizon, you still need to zoom in and think about tactics when it comes time to execute. If you were a buyer of EURUSD yesterday at 10 a.m., for example, but you knew that EURUSD tends to bottom at 11 a.m. on corporate month end (see the next section of today’s am/FX)… You could have bought at 1.0478 at 11 a.m. instead of paying a 1.0502 offer at 10 a.m. These kind of small improvements in execution timing can often deliver much more value than trying to find a way to shave 0.2 pips off the fill at time of execution.
Knowing microstructure stories and flow patterns can help you time your entries and exits better, even if your trading time horizon is generally three months. Too often, people just execute whenever they have an idea, instead of taking a few minutes to ask whether the random point at which they came to a trading decision is actually the optimal time to execute the trade. Very often it’s not.
First, let me reprint some faulty analysis I did in 2017. If you know why it’s wrong before you read the whole thing, you are either a genius or you already know about Arcsine Law. The following is an excerpt from a daily I wrote toward the end of 2017.
Have you ever noticed that the yearly highs and lows in G7 FX tend to happen more at the start and end of the year (and less in the middle)? It is true. We ran the numbers, and they were so extreme that I did not believe them. So we ran them again and I manually checked a bunch of it because again, I was shocked at the non-randomness of the distribution. Here is how annual highs and lows are distributed (by month) over the year for the G7 currencies:
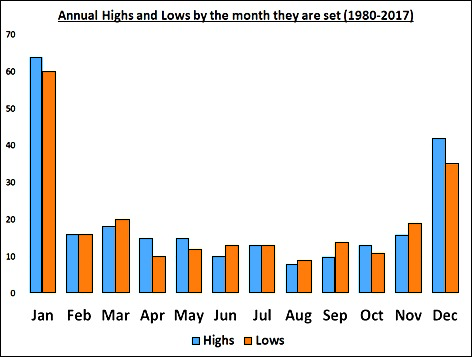
EURUSD USDJPY USDCAD NZDUSD AUDUSD USDCHF and GBPUSD
y-axis shows sum of how many times it happened
Now obviously there is a USD component to all these pairs so if one makes a high or low at a certain time, it is likely all the others probably will too. But the extremeness of the skew in the distribution is amazing. But wait! It gets crazier!
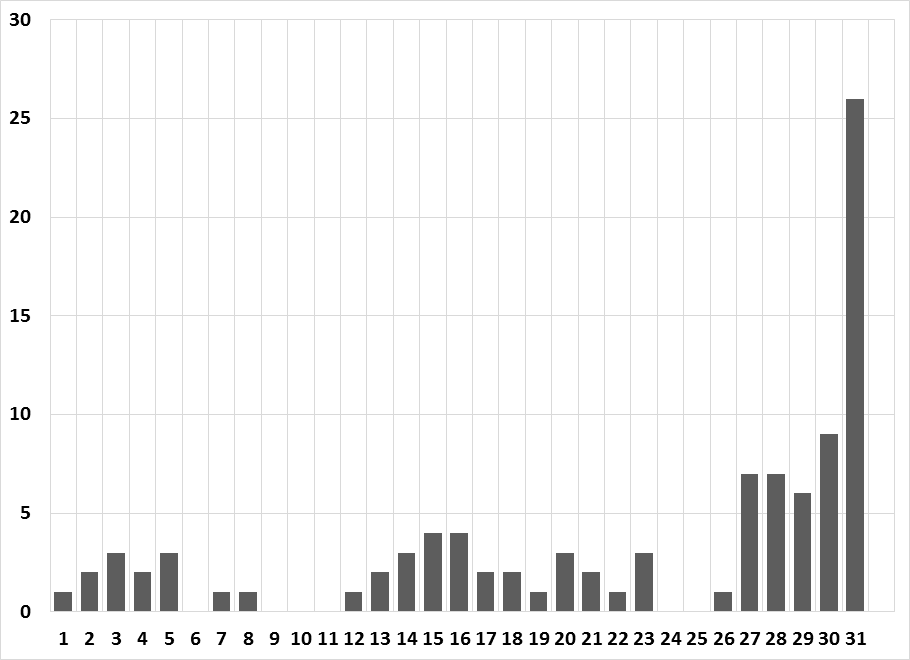
If you look at all the times a currency makes its year high or low in January, check out the day of January that it happens:
If a currency pair makes year high or low in Jan., what day does it happen?
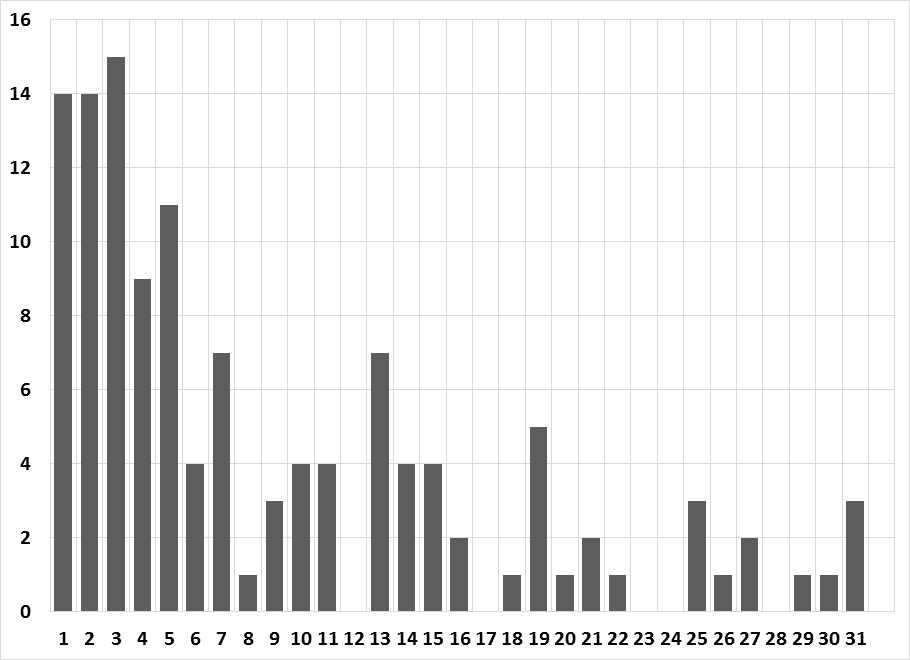
Y-axis is number of occurrences.
1980 to now. Synthetic EUR used for EUR pre-1999
Can you guess what December looks like?
If a currency pair makes its year high or low in Dec., what day does it happen?
Insane, right? This is a massive anomaly in what should be close to randomly-distributed data. Clearly year end transactions (which are often not price sensitive and more timing-related), window dressing, positioning for the new year and reduced liquidity create enough distortions to make even the most unrepentant ivory tower academic question EMH. The front of the month sees NFP and back of the month sees month-end rebalancing so that is a partial explanation. Am I missing any other explanations?
I grind up the data like this all the time and rarely have I seen a more extreme result.
Pretty cool stuff, I thought. Until I learned… MY ANALYSIS WAS TOTALLY WRONG.
I have seen others make this same mistake since and you will occasionally see excited commentaries like mine remarking on the U-shaped pattern of highs and lows in a data set. This can relate to data on any time slice, monthly, daily or hourly. For example, I have seen blogs comment recently that stock market highs and lows are more likely to occur near the open and the close, vs. the middle of the day. It’s the same fallacy.
In a random walk process, there is not a uniform distribution of highs and lows throughout the day, week, month or year. Instead, we see a U-shaped pattern with more highs and lows near the start and the end of the series. This fundamental property of random walks is described by a counterintuitive branch of probability known as Arcsine law.
If you spend a bit of time thinking about a random walk, it starts to make sense that the high or low is more likely to occur at the start or end of the year. Imagine a series of coin flips where you simply add 1 for heads or subtract 1 for tails. The longer you flip the coin, the farther the sum will move away from the starting point (zero) and thus the start and end point are more likely to be the extreme points relative to any point in between. Our intuition is that they would oscillate around zero, but this is not the case. They slowly move away.
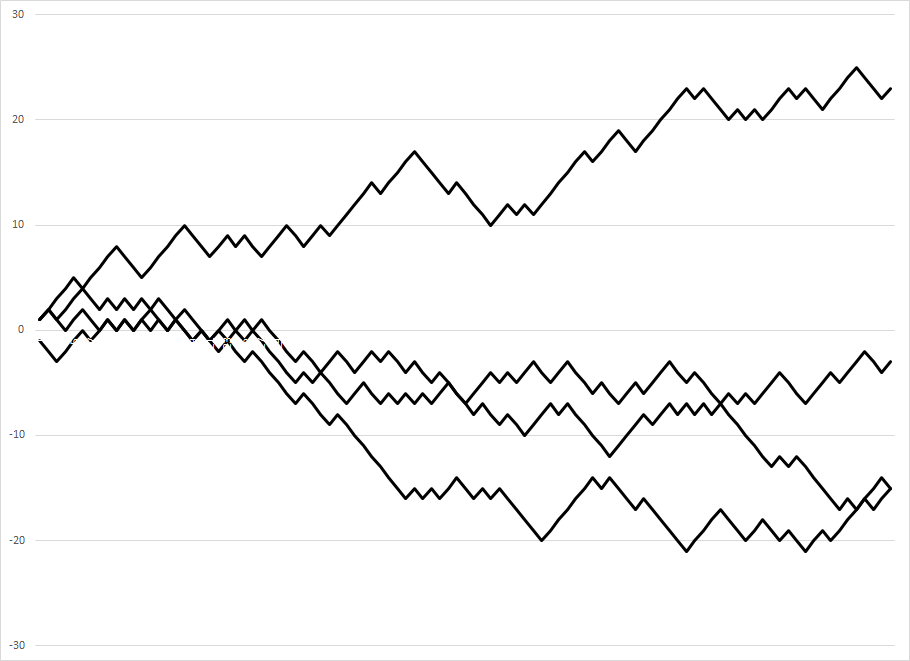
This next chart shows how random walks slowly make their way further and further from the starting point of zero. Therefore, the extreme low and high points appear more often near the start or the end of the series.
Cumulative sum of heads (+1) and tails (-1) over four simulations
OK, back to the here and now. On corporate month end, EURUSD tends to go down, GBPUSD tends to go down, USDJPY tends to go up, etc. So, if the high of day for the USD is not random, it should peak at a specific time, not the start or end of the day. Remember that random walks produced a U-shaped histogram of highs over the time period. So, if it’s not U-shaped, it’s less likely to be random.
Here are the charts:
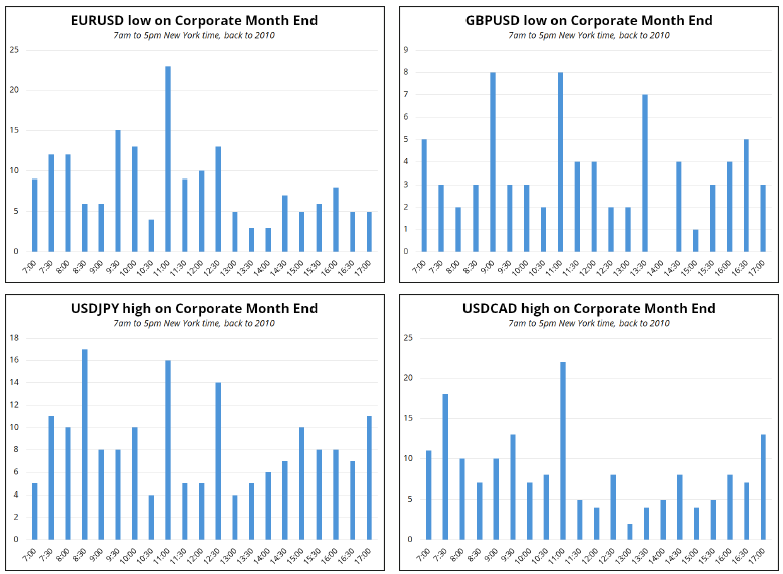
Not random. The peaks cluster mostly around 11 a.m., which is the peak volume time for FX and therefore this is almost certainly not a coincidence. The other peak is 8:30/9:00 which probably reflects strong US economic data releases.
For practical purposes, if want to sell USD on t-2, you should be looking to do it at 11:00 a.m., or just before. This analysis uses 30-minute BFIX data, so we do not capture the absolute high, we capture the highest print in 30-minute increments.
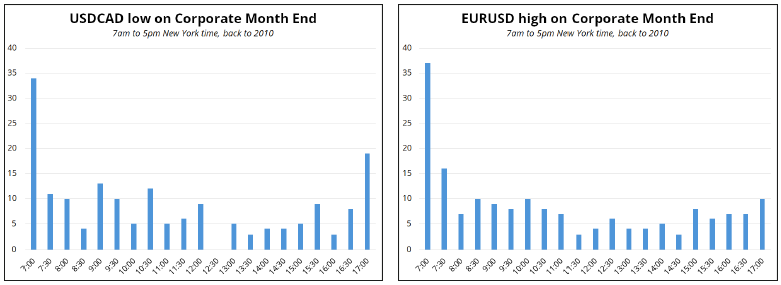
And one more thing before we conclude. If you look at when the USD makes its low, you would think it would either be at 7 a.m. (because the USD tends to go up + arcsine law) or at 5 p.m., as per arcsine law. Up next, I show the times of the USD lows for USDCAD and EURUSD.
They fit the random pattern of clustering near the start and end of the series, with a bias to the start because the USD goes up on corporate month end. As we know the USD rallies on this particular day of the month, we would guess it should most often make the low at the open.
And it does.
Neat.
Final thoughts
I am getting a bit antsy on this CADJPY put spread as it’s now quite in the money, but I am going to wait another day or two and see how it transpires. Moving the AUDNZD lower now that RBNZ is out of the way.
Author

Brent Donnelly
Spectra Markets
Brent Donnelly is the President of Spectra Markets. He has been trading currencies since 1995 and writing about macro since 2004. Brent is the author of “Alpha Trader” (2021) and “The Art of Currency Trading” (Wiley, 2019).


