Unravelling the Gold conundrum: Analysing the decline to come from $1980 to $1900

Technical outlook
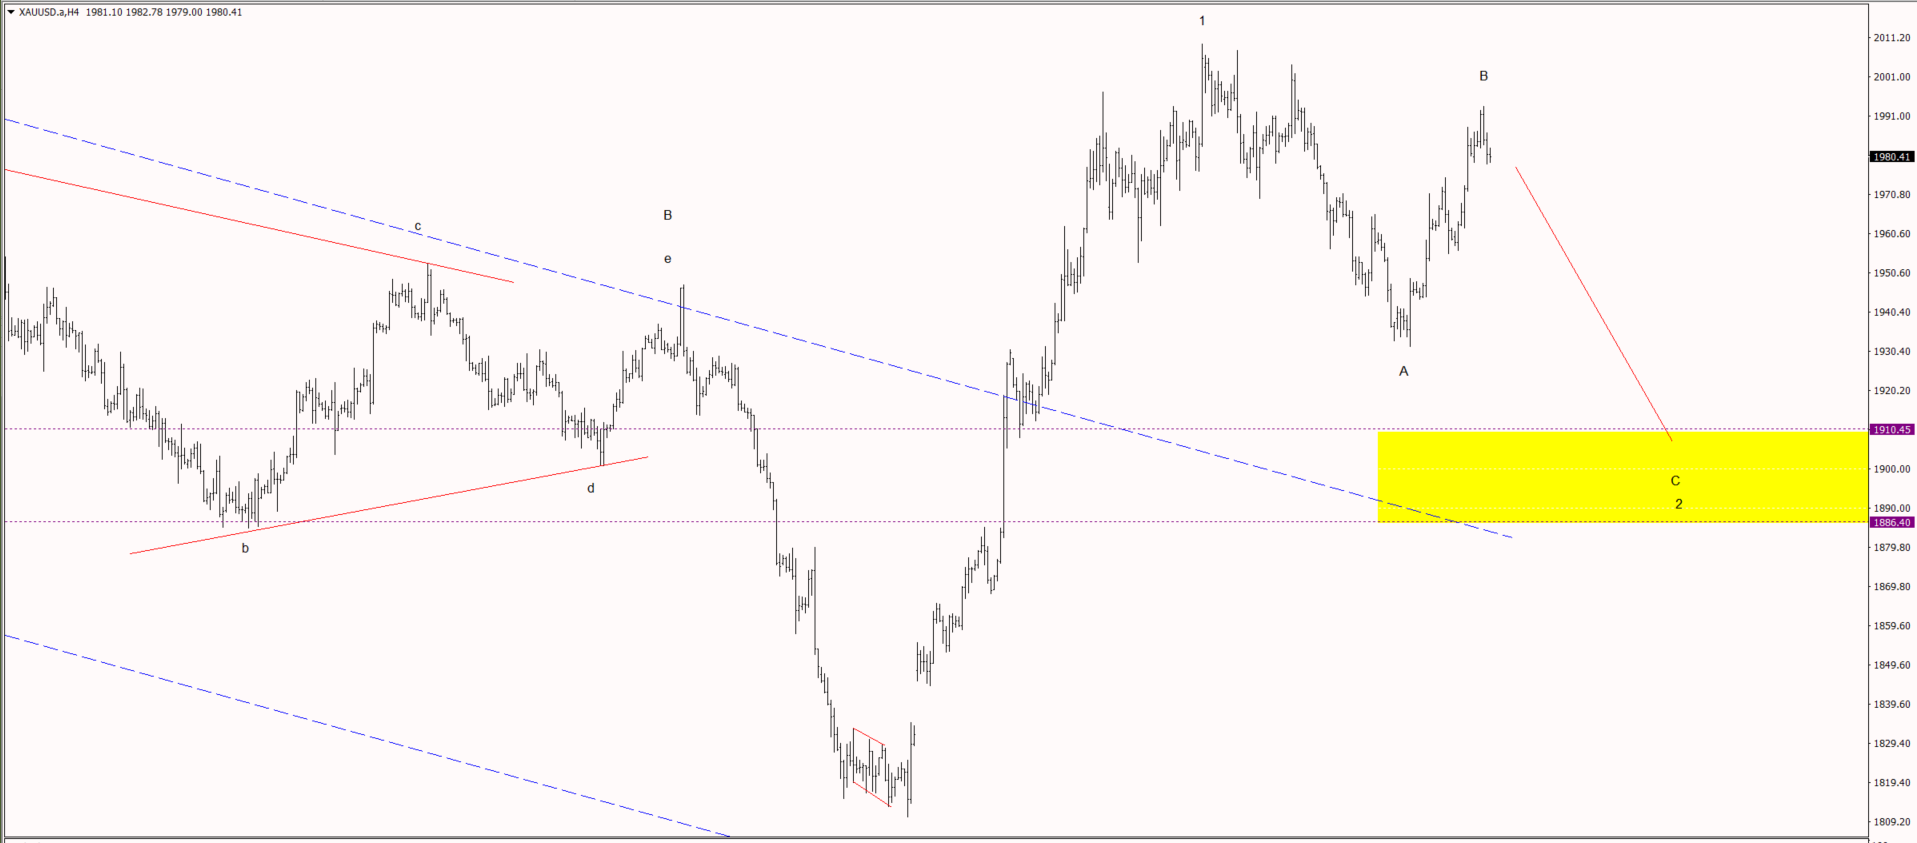
The chart below shows gold currently trading at 1980.41 which came of the 78.6 Fibonacci retracement of the wave A lower. We see gold prices moving lower down to the yellow zone in an ABC correction. Wave A has been completed we believe wave B is also complete and we are in the process of moving lower in wave C to complete the correction.
We need to see price action continue lower in a more impulsive manner to confirm we are in wave C. The ideal trade setup would be to wait for price action to reach the yellow zone and start placing long trades targeting all-time highs in gold. The more aggressive trader would enter at current levels and target 1910 as a take profit for the move lower.
Key news events to look out for: Tuesday 21st USD FOMC Meeting Minutes, Wednesday 22nd USD Unemployment Claims and Revised UoM Consumer Sentiment, Friday 24th USD Flash Manufacturing PMI and Flash Services PMI.
Res:1992.79; 2009.39; 2027.60
Sup:1934.24; 1910.45; 1886.40
Fundamental outlook
Gold, the age-old symbol of wealth and stability, has long been a barometer for economic conditions. Investors closely watch its price movements as they navigate the tumultuous seas of the global market. In this article, we delve into the key factors behind the coming decline, examining the economic forces and market dynamics at play.
The 2020 Gold rush:
The year 2020 marked a significant surge in gold prices, driven primarily by the economic uncertainties stemming from the global pandemic. Investors, seeking safe-haven assets, flocked to gold as a reliable store of value. This led to a rapid increase in demand, driving prices to unprecedented levels.
Global economic recovery:
As the world gradually emerged from the depths of the pandemic, signs of economic recovery began to materialize. Governments implemented stimulus measures, central banks adopted accommodative monetary policies, and vaccination campaigns gained momentum. The prospect of a robust economic rebound diminished the urgency for safe-haven assets, prompting a shift in investor sentiment away from gold.
Rising interest rates:
One of the primary drivers behind the decline in gold prices has been the anticipation and actualization of rising interest rates. Central banks, including the U.S. Federal Reserve, signalled a shift towards tightening monetary policy to address concerns about inflation. Higher interest rates make alternative investments more attractive, and the opportunity cost of holding non-interest-bearing assets like gold increases, leading to a decrease in demand.
Market sentiment and technical factors:
Apart from economic fundamentals, market sentiment and technical factors will influence the decline in gold prices. Profit-taking by investors who benefitted from the earlier surge, as well as technical corrections in response to overbought conditions, will contribute to the downward trend.
The journey of gold prices from $1980 to $1900 reflects the intricate dance between economic indicators, market sentiment, and global conditions. As investors and analysts navigate this complex landscape, it is crucial to remain vigilant to the ever-changing factors that influence the precious metal's value. While the recent dip may be a temporary phenomenon, it underscores the importance of staying informed and adaptable in the dynamic world of commodity markets.
Author

Mthokozisi Mpofu
Knars Capital
Mthokozisi Mpofu is the Managing Director of Knars Capital Pvt Ltd, an investment advisory firm helping African SMEs secure growth capital and become investor-ready.

















