Ukraine summit comes to town

USD: Sept '25 is Down at 97.815.
Energies: Sep '25 Crude is Down at 61.90.
Financials: The Sep '25 30 Year T-Bond is Higher by 7 ticks and trading at 114.00.
Indices: The Sep '25 S&P 500 emini ES contract is 31 ticks Lower and trading at 6461.50.
Gold: The Dec'25 Gold contract is trading Up at 3388.20.
Initial conclusion
This is not a correlated market. The USD is Down and Crude is Down which is not normal, but the 30 Year T-Bond is trading Higher. The Financials should always correlate with the US dollar such that if the dollar is Higher, then the bonds should follow and vice-versa. The S&P is Lower and Crude is trading Lower which is not correlated. Gold is trading Higher which is correlated with the US dollar trading Down. I tend to believe that Gold has an inverse relationship with the US Dollar as when the US Dollar is down, Gold tends to rise in value and vice-versa. Think of it as a seesaw, when one is up the other should be down. I point this out to you to make you aware that when we don't have a correlated market, it means something is wrong. As traders you need to be aware of this and proceed with your eyes wide open. Asia traded Lower with the exception of the Indian Sensex exchange. Currently all of Europe is trading Higher.
Possible challenges to Traders
-
Building Permits is out at 8:30 AM EST. This is Major.
-
Housing Starts is out at 8:30 AM EST. This is Major.
-
FOMC Member Bowman Speaks at 10 AM EST. This is Major.
-
FOMC Member Bowman Speaks at 2:10 PM EST. This is Major.
Traders, please note that we've changed the Bond instrument from the 10 Year (ZN) to the 2 Year (ZT). They work exactly the same.
We've elected to switch gears a bit and show correlation between the 2-year Treasury notes (ZT) and the S&P futures contract. The YM contract is the Dow Jones Industrial Average, and the purpose is to show reverse correlation between the two instruments. Remember it's likened to a seesaw, when up goes up the other should go down and vice versa.
Yesterday the ZT dived Lower at around 8:30 AM EST with no news pending. The Dow climbed Higher at the same time. Look at the charts below and you'll see a pattern for both assets. The Dow climbed Higher at around 8:30 AM EST and the ZT Lower at around the same time. These charts represent the newest version of Bar Charts, and I've changed the timeframe to a 15-minute chart to display better. This represented a Short opportunity on the 2-year note, as a trader you could have netted about a dozen ticks per contract on this trade. Each tick is worth $6.25. Please note: the front month for ZT is now Sep '25 and the Dow is now Sep '25. I've changed the format to filled Candlesticks (not hollow) such that it may be more apparent and visible.
Charts courtesy of BarCharts
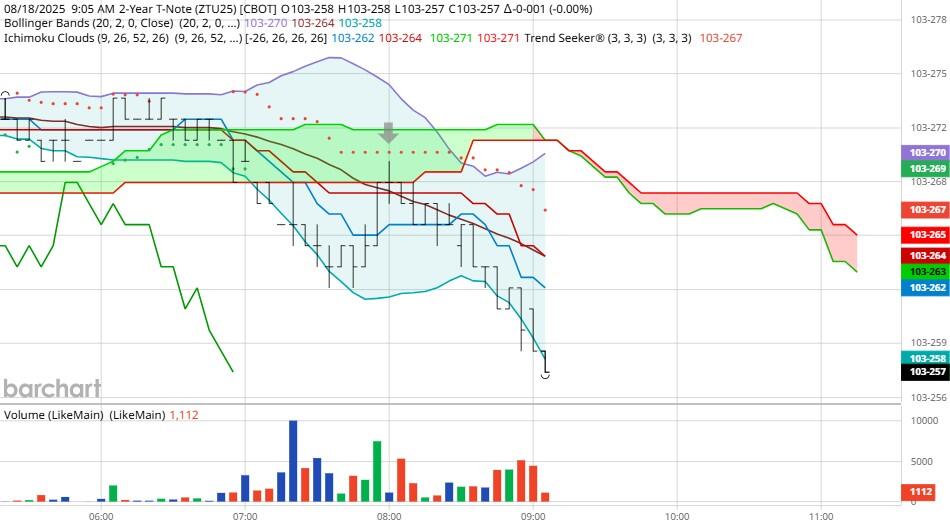
ZT -Sep 25 - 8/18/25
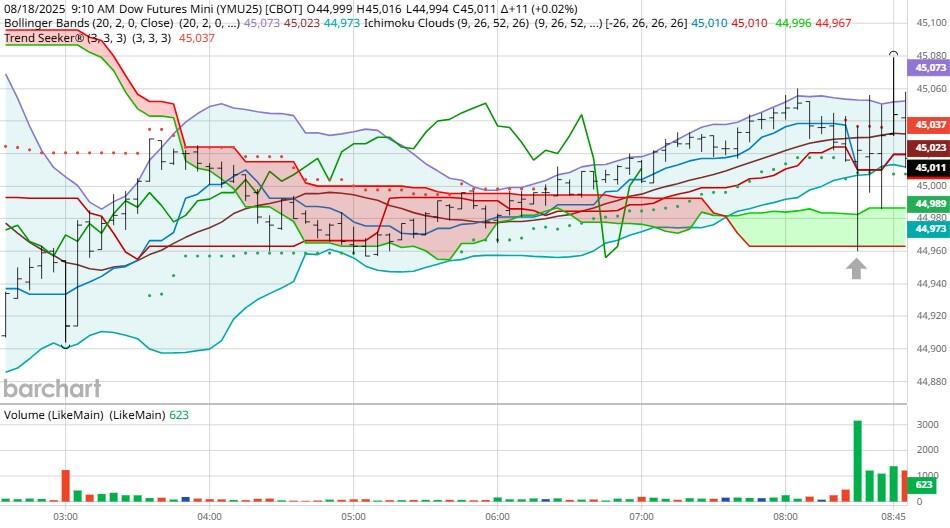
Dow - Sep 2025- 8/18/25
Bias
Yesterday we gave the markets a Downside bias and the markets didn't disappoint. The Dow dropped 34 points on the session, the S&P lost ground, but the Nasdaq managed a slight gain on the day. Today we aren't dealing with a correlated market, and our bias is Neutral or Mixed.
Could this change? Of Course. Remember anything can happen in a volatile market.
Commentary
So, yesterday Trump had his session with the president of the Ukraine as well as 7 European Leaders from various countries. Unfortunately, as of this writing, nothing was as yet agreed upon except that another meeting will take place. When and where isn't known yet. The main thrust of the meeting was ceasefire first, then a peace treaty or vice-versa. Time will tell how this all works out. Want to learn Market Correlation and determine market direction hours before the Opening Bell?
Author

Nick Mastrandrea
Market Tea Leaves


