UI rate up, markets down

USD: Jun '24 is Up at 105.135.
Energies: Jul '24 Crude is Up at 75.99.
Financials: The Sept '24 30 Year T-Bond is Down 19 ticks and trading at 116.30.
Indices: The Jun '24 S&P 500 emini ES contract is 19 ticks Lower and trading at 5351.00.
Gold: The Jun'24 Gold contract is trading Down at 2317.90
Initial conclusion
This is not a correlated market. The USD is Up and Crude is Up which is not normal, but the 30 Year T-Bond is trading Down. The Financials should always correlate with the US dollar such that if the dollar is Higher, then the bonds should follow and vice-versa. The S&P is Lower and Crude is trading Higher which is correlated. Gold is trading Lower which is correlated with the US dollar trading Up. I tend to believe that Gold has an inverse relationship with the US Dollar as when the US Dollar is down, Gold tends to rise in value and vice-versa. Think of it as a seesaw, when one is up the other should be down. I point this out to you to make you aware that when we don't have a correlated market, it means something is wrong. As traders you need to be aware of this and proceed with your eyes wide open. Asia is trading Mixed with half the exchanges Higher and the other half Lower. Currently all of Europe is trading Lower.
Possible challenges to traders
-
No Major Economic news to speak of.
-
Lack of Major Economic News.
Treasuries
Traders, please note that we've changed the Bond instrument from the 10 year (ZN) to the 2 year (ZT). They work exactly the same.
We've elected to switch gears a bit and show correlation between the 10-year Treasury notes (ZN) and the S&P futures contract. The YM contract is the Dow Jones Industrial Average, and the purpose is to show reverse correlation between the two instruments. Remember it's likened to a seesaw, when up goes up the other should go down and vice versa.
On Friday the ZT migrated Lower at around 8:30 AM EST after the Jobs numbers were released. If you look at the charts below the ZT gave a signal at around 8:30 AM and started its Downward slide. Look at the charts below and you'll see a pattern for both assets. The Dow moved Higher at around 8:30 AM and the ZT moved Lower at around the same time. These charts represent the newest version of Barcharts and I've changed the timeframe to a 15-minute chart to display better. This represented a Short opportunity on the 2-year note, as a trader you could have netted about 20 plus ticks per contract on this trade. Each tick is worth $7.625. Please note: the front month for both the ZT is Sept and the S&P is still Jun '24. I've changed the format to filled Candlesticks (not hollow) such that it may be more apparent and visible.
Charts courtesy of barcharts
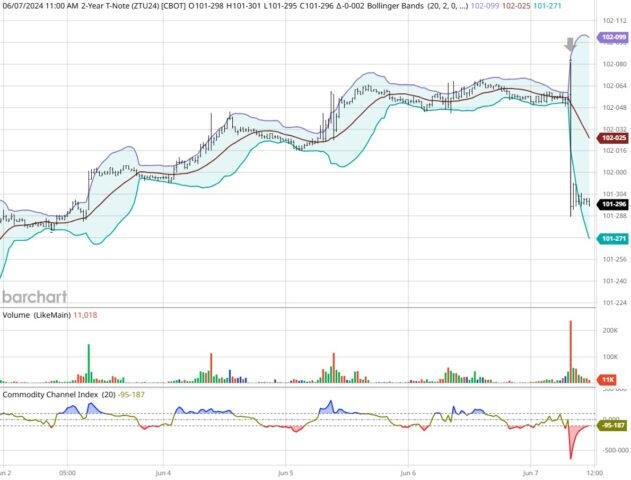
ZT -Sept 2024 - 06/07/24
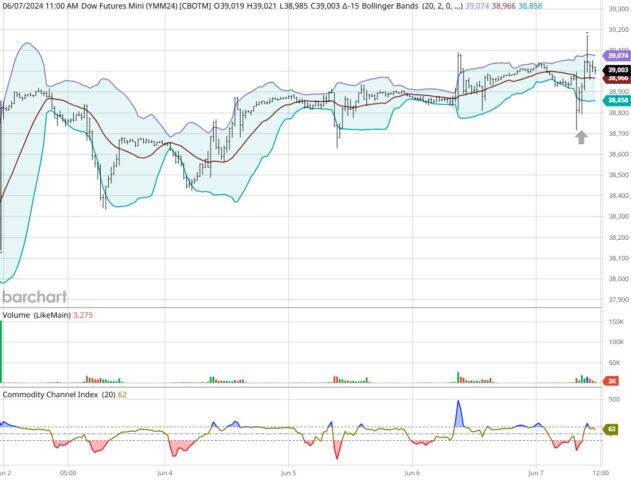
S&P - Jun 2024 - 06/07/24
Bias
Last Friday as is our custom we gave the markets a Neutral or Mixed bias and the markets traded Mixed. Why? Because the markets have never shown any sense of normalcy on Jobs Friday. The Dow closed Lower by 87 points, and the other indices closed Lower as well. Today we aren't dealing with a correlated market and our bias is Neutral.
Could this change? Of Course. Remember anything can happen in a volatile market.
Commentary
So, Jobs Friday came and despite the fact that the US economy created 272,000 net new jobs last month, the Unemployment Rate rose to 4.0% versus 3.9% that was previously reported last month. This created chaos in the markets as they first shot up but then migrated Lower as the session wore on. This is the reason why we always maintain a Neutral or Mixed bias, as the markets could go anywhere and often does. Today we have no major economic news to rely upon or to help drive the markets Higher. The markets will need to rely on its own devices today to determine direction. Will this help or hinder us? Only time will tell.....
Author

Nick Mastrandrea
Market Tea Leaves


