UI numbers doesn’t drag down markets

USD: Jun '23 is Up at 103.525.
Energies: Jul '23 Crude is Down at 71.22.
Financials: The Sep '23 30 Year T-Bond is Down 14 ticks and trading at 127.06.
Indices: The Jun '23 S&P 500 emini ES contract is 22 ticks Lower and trading at 4292.25.
Gold: The Aug'23 Gold contract is trading Down at 1977.60. Gold is 10 ticks Lower than its close.
Initial conclusion
This is not a correlated market. The USD is Down, Crude is Up which is normal, and the 30 Year T-Bond is trading Lower. The Financials should always correlate with the US dollar such that if the dollar is Higher, then the bonds should follow and vice-versa. The S&P is Higher, and Crude is trading Higher which is not correlated. Gold is trading Higher which is correlated with the US dollar trading Down. I tend to believe that Gold has an inverse relationship with the US Dollar as when the US Dollar is down, Gold tends to rise in value and vice-versa. Think of it as a seesaw, when one is up the other should be down. I point this out to you to make you aware that when we don't have a correlated market, it means something is wrong. As traders you need to be aware of this and proceed with your eyes wide open. At the present time Asia is trading Mixed. Currently Europe is trading predominantly Higher with the exception of the London exchange which is down fractionally at this point.
Possible challenges to traders today
-
No Major economic news to speak of.
-
Lack of Major economic news.
Treasuries
Traders, please note that we've changed the Bond instrument from the 30 year (ZB) to the 10 year (ZN). They work exactly the same.
We've elected to switch gears a bit and show correlation between the 10-year bond (ZN) and the S&P futures contract. The S&P contract is the Standard and Poor's, and the purpose is to show reverse correlation between the two instruments. Remember it's likened to a seesaw, when up goes up the other should go down and vice versa.
Yesterday the ZN migrated Higher at around 8:15 AM EST as the S&P hit a High at around the same time. If you look at the charts below the ZN gave a signal at around 8:15 AM and the ZN continued its Upward trend. Look at the charts below and you'll see a pattern for both assets. S&P hit a High at around 8:15 AM and migrated Lower. These charts represent the newest version of MultiCharts and I've changed the timeframe to a 15-minute chart to display better. This represented a Long opportunity on the 10-year note, as a trader you could have netted about 20 ticks per contract on this trade. Each tick is worth $15.625. Please note: the front month for the ZN is now Jun '23. The S&P contract is also Jun' 23. I've changed the format to filled Candlesticks (not hollow) such that it may be more apparent and visible.
Charts courtesy of MultiCharts built on an AMP platform
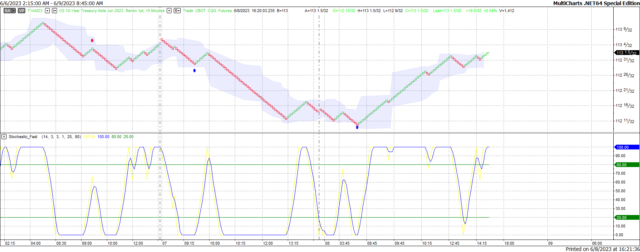
ZN - Jun 2023 - 6/08/23
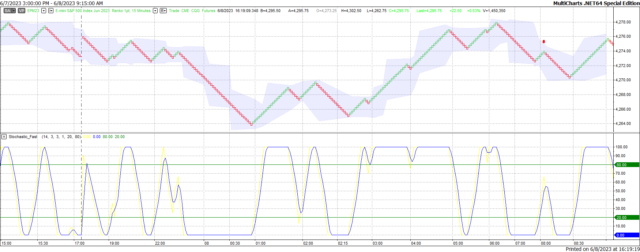
S&P - Jun 2023 - 6/08/23
Bias
Yesterday we gave the markets an Upside bias as both the USD and the Bonds were pointed Lower Thursday morning and this usually represents an Upside Day. The markets didn't disappoint as the Dow closed 169 points Higher and the other indices closed Higher as well. Today we aren't dealing with a correlated market and our bias is Neutral or Mixed.
Could this change? Of Course. Remember anything can happen in a volatile market.
Commentary
Yesterday we gave the markets an Upside bias as both the USD and the Bonds were trading Lower Thursday morning. This usually resembles an Upside Day hence the Upside bias. Then 8:30 AM EST came and the weekly Unemployment numbers came out. They came in at 261,000 versus 236,000 expected and this was the highest UI numbers in 6 months. At first the markets reacted accordingly and fell. However, after 10 AM EST the markets rebounded and remained in positive territory the entire session, with the Dow closing 169 points Higher. Must be something to this correlation stuff we keep talking about.
Author

Nick Mastrandrea
Market Tea Leaves


