UI claims drags down markets [Video]
![UI claims drags down markets [Video]](https://editorial.fxstreet.com/images/TechnicalAnalysis/Intermarket/Correlation/it-must-work-gm537868515-58464346_XtraLarge.jpg)
US Dollar: Mar '22 USD is Up at 94.790.
Energies: Feb '22 Crude is Up at 83.08.
Financials: The Mar '22 30 Year bond is Down 20 ticks and trading at 155.29.
Indices: The Mar '22 S&P 500 Emini ES contract is 30 ticks Higher and trading at 4959.50.
Gold: The Feb'22 Gold contract is trading Up at 1823.30. Gold is 19 ticks Higher than its close.
Initial conclusion
This is not a correlated market. The dollar is Up, and Crude is Up which is not normal, but the 30-year Bond is trading Lower. The Financials should always correlate with the US dollar such that if the dollar is lower, then the bonds should follow and vice-versa. The S&P is Higher, and Crude is trading Higher which is not correlated. Gold is trading Higher which is not correlated with the US dollar trading Up. I tend to believe that Gold has an inverse relationship with the US Dollar as when the US Dollar is down, Gold tends to rise in value and vice-versa. Think of it as a seesaw, when one is up the other should be down. I point this out to you to make you aware that when we don't have a correlated market, it means something is wrong. As traders you need to be aware of this and proceed with your eyes wide open. Currently all of Asia is trading Lower with the exception of the Singapore exchange which is Higher. Currently all of Europe is trading Lower. .
Possible challenges to traders today
-
Core Retail Sales is out at 8:30 AM EST. This is Major.
-
Retail Sales is out at 8:30 AM EST. This is Major
-
Import Prices m/m are out at 8:30 AM EST. This is Major.
-
Industrial Production is out at 9:15 AM EST. This is Major.
-
Capacity Utilization Rate is out at 9:15 AM EST. This is Major.
-
Prelim UoM Consumer Sentiment is out at 10 AM EST. Major.
-
Prelim UoM Inflation Expectations is out at 10 AM EST. Major.
-
Business Inventories m/m are out at 10 AM EST. Major.
-
FOMC Member Williams Speaks at 11 AM EST. Major.
Treasuries
Traders, please note that we've changed the Bond instrument from the 30 year (ZB) to the 10 year (ZN). They work exactly the same.
We've elected to switch gears a bit and show correlation between the 10-year bond (ZN) and the S&P futures contract. The S&P contract is the Standard and Poor's, and the purpose is to show reverse correlation between the two instruments. Remember it's likened to a seesaw, when up goes up the other should go down and vice versa.
Yesterday the ZN made its move at around 9 AM EST. The ZN hit a High around that time and the S&P moved Higher. If you look at the charts below ZN gave a signal at around 9 AM EST and the S&P moved Higher at around the same time. Look at the charts below and you'll see a pattern for both assets. ZN hit a High at around 9 AM EST and the S&P was moving Higher shortly thereafter. These charts represent the newest version of MultiCharts and I've changed the timeframe to a 15-minute chart to display better. This represented a Shorting opportunity on the 10-year note, as a trader you could have netted about 10 ticks per contract on this trade. Each tick is worth $15.625. Please note: the front month for the ZN is now Mar '22. The S&P contract is now Mar '22 as well. I've changed the format to Renko bars such that it may be more apparent and visible.
Charts Courtesy of MultiCharts built on an AMP platform
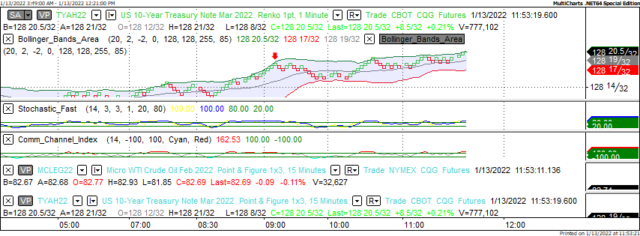
ZN - Mar 2022 - 01/13/22
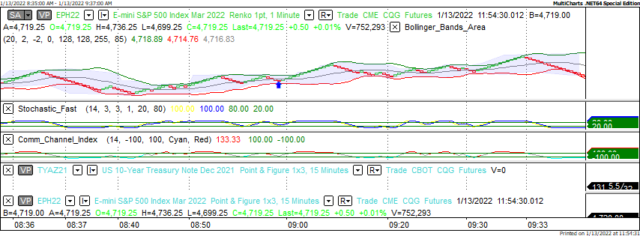
S&P - Mar 2022 - 01/13/22
Bias
Yesterday we gave the markets an Upside bias as the futures were correlated in that direction. The markets however had other ideas as the Dow dropped 177 points and the other indices lost ground as well. Today we aren't dealing with a correlated market and our bias is Neutral.
Could this change? Of Course. Remember anything can happen in a volatile market.
Commentary
So yesterday morning when we viewed the markets, they were correlated to the Upside and even in pre-market, they were advancing. However, Unemployment Claims were released that showed again in claims and the markets didn't view that favorably and dropped. As we say each and every day this too can change as the markets are very volatile to say the least. Today we have 9 economic reports, all of which are major, and Monday is MLK with the markets being closed. We will be back on Tuesday, January 18th.
Author

Nick Mastrandrea
Market Tea Leaves


