Two New Leading Indicators

There are two trends that go counter to the go-go forecasts from recent tax cuts in the U.S. – which are obviously positive, at least for the near term.
Stocks have loved this free gift from President Trump, but long-term statistics show that corporations do NOT increase capital investments when taxes fall.
They do so when the economy grows and they need more capacity, which is not the case currently at a low 75% capacity utilization. Or, they reduce such investments during recessions.
Historically, capital investments have trended at around 18% of GDP.
But back to the two leading indicators…
The first is that global quantitative easing is “easing.”
It’s been declining since March 2017. On about a 12- to 18-month lag, that would be negative for the U.S. and global economy. Look at this chart…
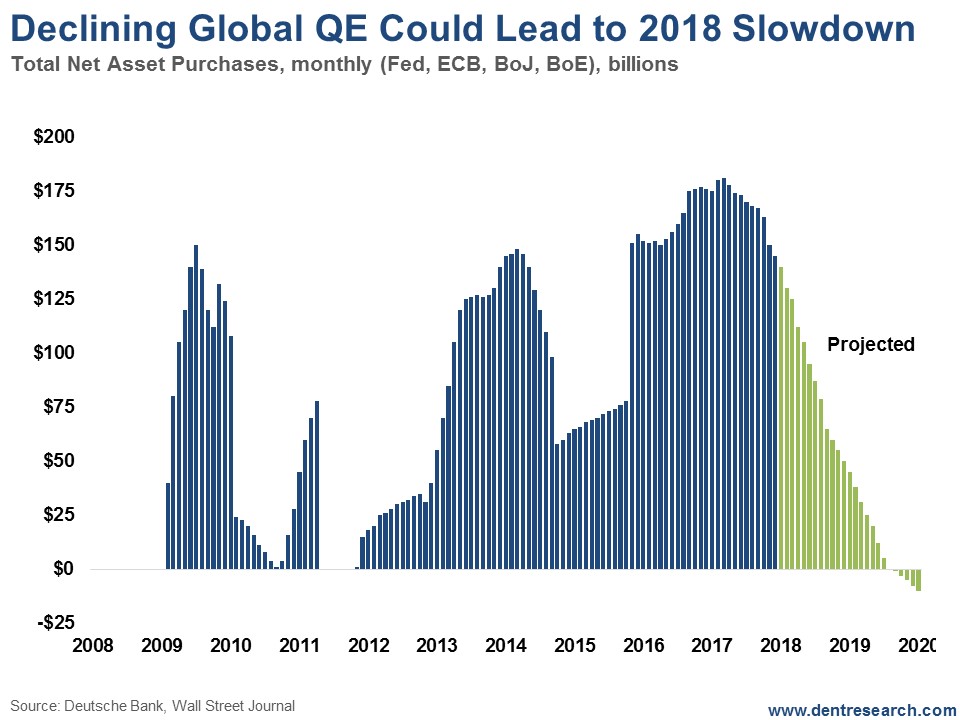
Note the extreme surge in QE in early 2009 forward and the strong recovery that followed… and the pullback in early 2011 that saw a slowdown in the markets into late 2011.
Also note the slowdown from the Fed in the U.S. in 2014 that saw a slowdown in the economy and stock markets into early 2016 for stocks.
Now that QE is in decline, if this indicator proves accurate, we should start to see a slowdown in the economy sometime in the first half of 2018 or the summer at the latest. Almost no one expects that and a strong expected Q1 GDP forecast will just make the growth story stronger for now.
This could mean a recession, which would mean a market crash… or just back to 2% growth and a substantial correction when 3% to 4% doesn’t materialize, as we’ve been warning it won’t.
The second trend relates to Bitcoin…
For a while now I’ve been warning that Bitcoin could be the pin that could prick this stock bubble, just like internet stocks were the pin in early 2000.
Well, it turns out there’s an approximate nine-week lag between the extreme late-stage Bitcoin bubble and the Dow.
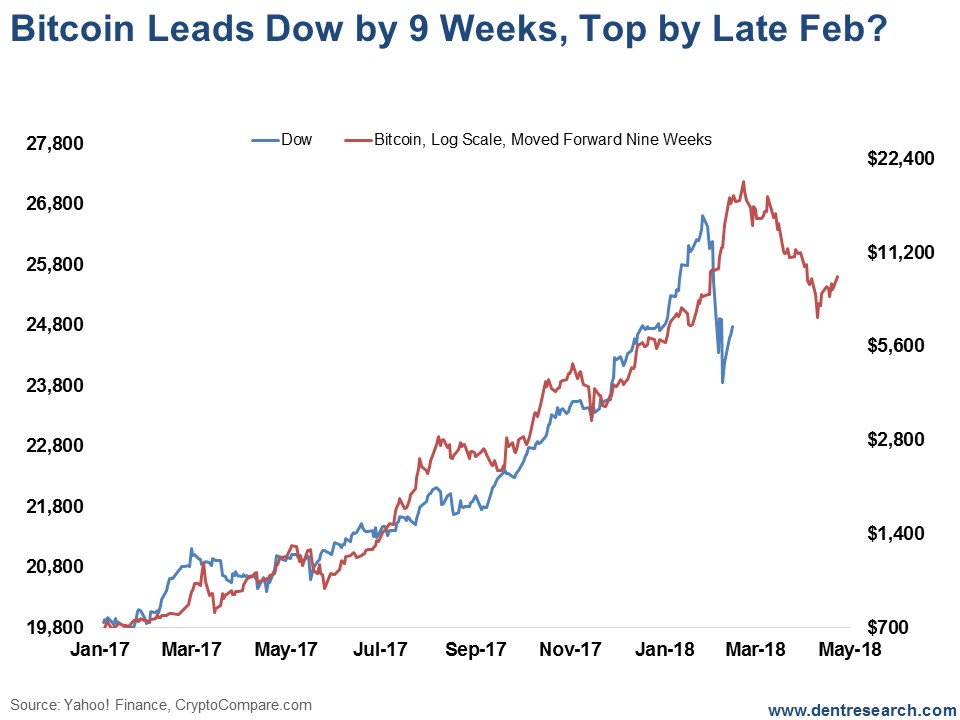
The recent peak in Bitcoin in mid- December 2017 would suggest a potential top in stocks by mid- to late February or early March, at the latest. It’s possible that top was already put in on January 27.
So, we’ll be monitoring these indicators closely and will keep you updated.
In such an artificial bubble, inflated by nothing more than massive QE/money printing and now free-lunch tax cuts, most traditional indicators of a market top aren’t likely to manifest.
These two new indicators could give us the warning we need.
The best confirmation would be a convincing break of the bottom trend-line in the Nasdaq in its bearish wedge that I showed on January 24. The market did break that on February 9, but turned around and rallied. If it tests that line again, it is likely to break and then we could see the market down 40% or so by late April.
We’ll see over the next month or so, but caution is warranted in this parabolic market.
Author

Harry S. Dent, MBA
Dent Research
Harry S. Dent Jr. studied economics in college in the ’70s, but found it vague and inconclusive. He became so disillusioned by the state of his chosen profession that he turned his back on it.


