US Dollar: Sept. USD is Down at 96.095.

Energies: Sept '18 Crude is Up at 67.77.

Financials: The Sept 30 year bond is Down 10 ticks and trading at 144.00.

Indices: The Sept S&P 500 emini ES contract is 44 ticks Higher and trading at 2836.50.

Gold: The Dec Gold contract is trading Up at 1201.90 Gold is 30 ticks Higher than its close.

Initial Conclusion

This is not a correlated market.  The dollar is Down- and Crude is Up+  which is normal and the 30 year Bond is trading Lower.  The Financials should always correlate with the US dollar such that if the dollar is lower then bonds should follow and vice-versa. The S&P is Higher and Crude is trading Higher which is not correlated. Gold is trading Down- which is not correlated with the US dollar trading Lower.   I tend to believe that Gold has an inverse relationship with the US Dollar as when the US Dollar is down, Gold tends to rise in value and vice-versa. Think of it as a seesaw, when one is up the other should be down. I point this out to you to make you aware that when we don't have a correlated market, it means something is wrong. As traders you need to be aware of this and proceed with your eyes wide open.

At this hour Asia is trading mainly Higher with the exception of the Hang Seng and Shanghai exchanges that are Lower at this time.  Currently all of Europe is trading Higher.

Possible Challenges To Traders Today

  • NFIB Small Business Index is out at 6 AM EST.  This is major.

  • Import Prices m/m is out at 8:30 AM EST.  This is major.

  • Mortgage Delinquencies.  This is major.
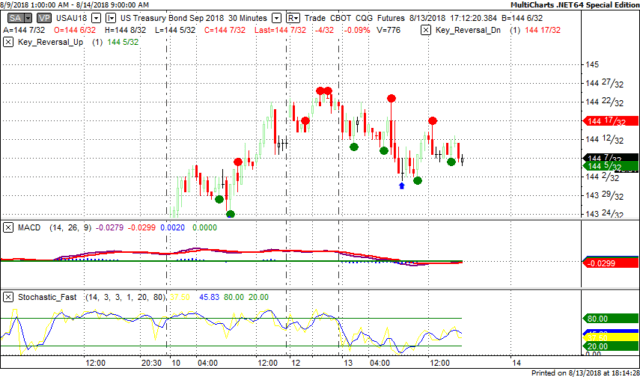
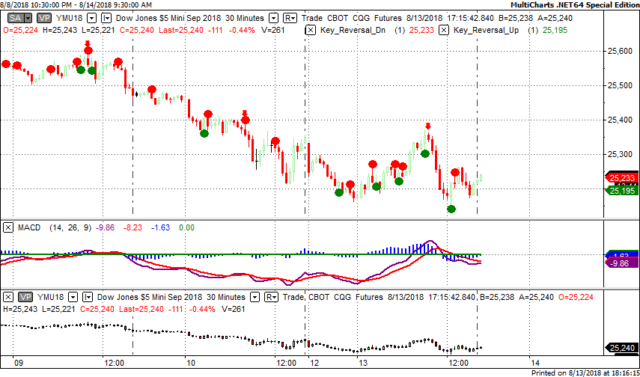
 Treasuries

We've elected to switch gears a bit and show correlation between the 30 year bond (ZB) and The YM futures contract.  The YM contract is the DJIA and the purpose is to show reverse correlation between the two instruments.  Remember it's liken to a seesaw, when up goes up the other should go down and vice versa.

Yesterday the ZB made it's move at around 9 AM EST.  The ZB hit a Low at around that time and the YM hit a High.  If you look at the charts below ZB gave a signal at around 9 AM EST and the YM was moving Lower at the same time. Look at the charts below and you'll see a pattern for both assets. ZB hit a Low at around 9 AM and the YM was moving Lower at the same time.  These charts represent the newest version of MultiCharts and I've changed the timeframe to a 30 minute chart to display better.  This represented a Long opportunity on the 30 year bond, as a trader you could have netted about 15 ticks per contract on this trade.  Each tick is worth $31.25.

Charts Courtesy of MultiCharts built on an AMP platform.

ZB


YM

Bias

Yesterday we gave the markets a Downside bias as the USD was trading Higher and the Bonds were on the cusp of going Higher.  The markets didn't disappoint as the Dow dropped 125 points and the other indices lost ground as well.  Today we aren't dealing with a correlated market and our bias is to the Upside.

Could this change? Of Course.  Remember anything can happen in a volatile market. 

Commentary

Yesterday we in essence witnessed a reprise of Friday as the markets dropped across the board for Day Two.  The question remains as to how long do we allow Turkey and the Turkish Lira to drive chaos across the global markets?  The reason why this is happening is because the perception is everyone else is doing it so why be late to the party?  Now I wouldn't call Turkey a 3rd rate power nor would I consider them to be a 3rd rate country; but they aren't a world power and yet the rest of the world is being hostage to their antics.  If they wanted to capture center stage for something they certainly achieved it but now we must get back to the business of business.

Trading performance displayed herein is hypothetical. The following Commodity Futures Trading Commission (CFTC) disclaimer should be noted.

Hypothetical performance results have many inherent limitations, some of which are described below. No representation is being made that any account will or is likely to achieve profits or losses similar to those shown.

In fact, there are frequently sharp differences between hypothetical performance results and the actual results subsequently achieved by any particular trading program. One of the limitations of hypothetical performance trading results is that they are generally prepared with the benefit of hindsight.

In addition, hypothetical trading does not involve financial risk, and no hypothetical trading record can completely account for the impact of financial risk in actual trading. For example, the ability to withstand losses or to adhere to a particular trading program in spite of trading losses are material points which can also adversely affect actual trading results.

There are numerous other factors related to the markets in general or to the implementation of any specific trading program which cannot be fully accounted for in the preparation of hypothetical performance results and all of which can adversely affect actual trading results.

Trading in the commodities markets involves substantial risk and YOU CAN LOSE A LOT OF MONEY, and thus is not appropriate for everyone. You should carefully consider your financial condition before trading in these markets, and only risk capital should be used.

In addition, these markets are often liquid, making it difficult to execute orders at desired prices. Also, during periods of extreme volatility, trading in these markets may be halted due to so-called “circuit breakers” put in place by the CME to alleviate such volatility. In the event of a trading halt, it may be difficult or impossible to exit a losing position.

Recommended Content


Recommended Content

Editors’ Picks

EUR/USD rises toward 1.0700 after Germany and EU PMI data

EUR/USD rises toward 1.0700 after Germany and EU PMI data

EUR/USD gains traction and rises toward 1.0700 in the European session on Monday. HCOB Composite PMI data from Germany and the Eurozone came in better than expected, providing a boost to the Euro. Focus shifts US PMI readings.

EUR/USD News

GBP/USD holds above 1.2350 after UK PMIs

GBP/USD holds above 1.2350 after UK PMIs

GBP/USD clings to modest daily gains above 1.2350 in the European session on Tuesday. The data from the UK showed that the private sector continued to grow at an accelerating pace in April, helping Pound Sterling gather strength.

GBP/USD News

Gold price flirts with $2,300 amid receding safe-haven demand, reduced Fed rate cut bets

Gold price flirts with $2,300 amid receding safe-haven demand, reduced Fed rate cut bets

Gold price (XAU/USD) remains under heavy selling pressure for the second straight day on Tuesday and languishes near its lowest level in over two weeks, around the $2,300 mark heading into the European session.

Gold News

Here’s why Ondo price hit new ATH amid bearish market outlook Premium

Here’s why Ondo price hit new ATH amid bearish market outlook

Ondo price shows no signs of slowing down after setting up an all-time high (ATH) at $1.05 on March 31. This development is likely to be followed by a correction and ATH but not necessarily in that order.

Read more

US S&P Global PMIs Preview: Economic expansion set to keep momentum in April

US S&P Global PMIs Preview: Economic expansion set to keep momentum in April

S&P Global Manufacturing PMI and Services PMI are both expected to come in at 52 in April’s flash estimate, highlighting an ongoing expansion in the private sector’s economic activity.

Read more

Majors

Cryptocurrencies

Signatures