S&P/TSX Composite is a Canadian stock market index representing roughly 70% of the market capitalization on the Toronto Stock Exchange. Under the ticker $TSX, one can track the market value of 250 most important companies. From 2009 to 2020, TSX was a rather weak performer. While S&P500 has gained 410% during that period, TSX made an advance of only 140%. One of the reasons for this lagging behavior could be the highly depressed commodity prices. As a matter of fact, Canadian companies are strongly represented in the oil, gas, metals and mining industries. Hence, it is obvious that in a period of strong US dollar and low commodity prices, those companies could not rise significantly. Currently, commodity prices seem to turn higher which can give a fuel for TSX for a long expected rally.


TSX Weekly Elliott Wave Analysis 07.14.2020

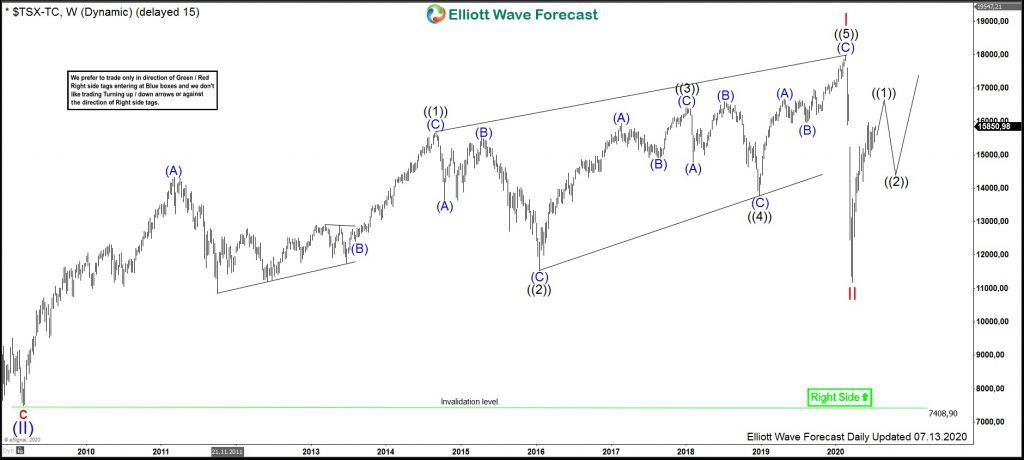
The weekly chart below shows the S&P/TSX Composite Index. From the march 2009 lows at 7408.9, the stock price has developed a cycle higher in wave I. It can be seen as a 3-3-3-3-3 Elliott Wave leading diagonal pattern. Waves ((1)) and ((4)) are overlapping in price which is a frequent feature of diagonal structures. Moreover, wave ((5)) demonstrates an RSI divergence with the wave ((3)). The 2009 cycle higher has ended by printing a high in February 2020 at 17970.5. This high has broken the 2007 highs opening up a weekly bullish sequence. Accordingly, while above 7408.9, pullbacks should find support in 3,7, 11 swings for more upside towards 22052-31093 area. From February 2020 highs, a sharp corection lower in wave II has retraced a big part of the cycle higher in wave I. It has found a bottom in March 2020 at 11144.6.

TSX


TSX Daily Elliott Wave Analysis 07.14.2020

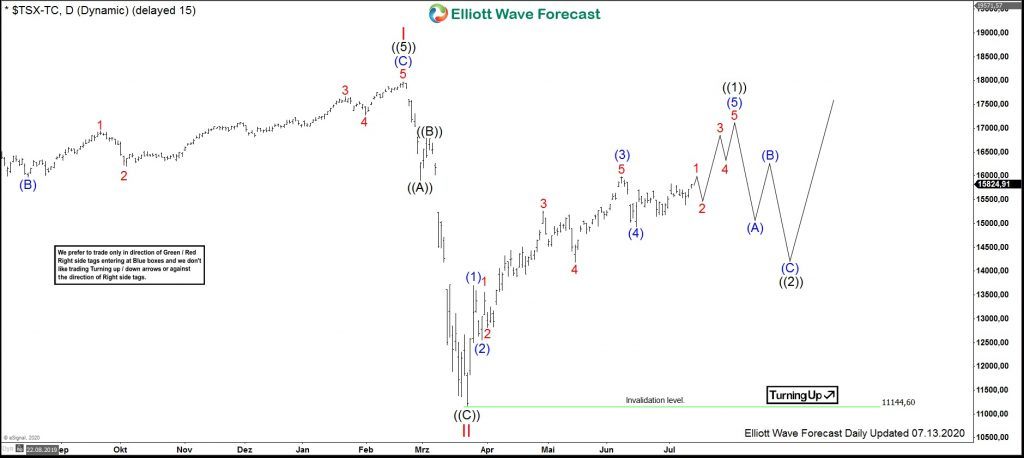
The daily chart below shows in more detail the decline lower in wave II and the following advance in wave ((1)). First, the decline itself is as an Elliott Wave zigzag structure. From march 2020 lows at 11144.6, where daily is turning up, one can count the internal waves (1)-(4) of an impulse in wave ((1)) higher. In short-term cycles, wave (5) of ((1)) may extend higher to end the march 2020 cycle. Hereby, break of the 15977.1 level would confirm that the wave (5) is already in progress. Once wave ((1)) is over, a correction lower in wave ((2)) should find support in 3, 7, 11 swings above the March lows at 11144.6. Then, expect advance in wave ((3)) of III towards 17970.5 and higher or a push in another leg higher at least.

If commodities are going to rally, then TSX might outperform US american indices providing a good investment possibility for long and medium term. As an outlook, TSX may rally to the weekly equal legs towards 22052-31093 area.

TSX

FURTHER DISCLOSURES AND DISCLAIMER CONCERNING RISK, RESPONSIBILITY AND LIABILITY Trading in the Foreign Exchange market is a challenging opportunity where above average returns are available for educated and experienced investors who are willing to take above average risk. However, before deciding to participate in Foreign Exchange (FX) trading, you should carefully consider your investment objectives, level of xperience and risk appetite. Do not invest or trade capital you cannot afford to lose. EME PROCESSING AND CONSULTING, LLC, THEIR REPRESENTATIVES, AND ANYONE WORKING FOR OR WITHIN WWW.ELLIOTTWAVE- FORECAST.COM is not responsible for any loss from any form of distributed advice, signal, analysis, or content. Again, we fully DISCLOSE to the Subscriber base that the Service as a whole, the individual Parties, Representatives, or owners shall not be liable to any and all Subscribers for any losses or damages as a result of any action taken by the Subscriber from any trade idea or signal posted on the website(s) distributed through any form of social-media, email, the website, and/or any other electronic, written, verbal, or future form of communication . All analysis, trading signals, trading recommendations, all charts, communicated interpretations of the wave counts, and all content from any media form produced by www.Elliottwave-forecast.com and/or the Representatives are solely the opinions and best efforts of the respective author(s). In general Forex instruments are highly leveraged, and traders can lose some or all of their initial margin funds. All content provided by www.Elliottwave-forecast.com is expressed in good faith and is intended to help Subscribers succeed in the marketplace, but it is never guaranteed. There is no “holy grail” to trading or forecasting the market and we are wrong sometimes like everyone else. Please understand and accept the risk involved when making any trading and/or investment decision. UNDERSTAND that all the content we provide is protected through copyright of EME PROCESSING AND CONSULTING, LLC. It is illegal to disseminate in any form of communication any part or all of our proprietary information without specific authorization. UNDERSTAND that you also agree to not allow persons that are not PAID SUBSCRIBERS to view any of the content not released publicly. IF YOU ARE FOUND TO BE IN VIOLATION OF THESE RESTRICTIONS you or your firm (as the Subscriber) will be charged fully with no discount for one year subscription to our Premium Plus Plan at $1,799.88 for EACH person or firm who received any of our content illegally through the respected intermediary’s (Subscriber in violation of terms) channel(s) of communication.

Recommended Content


Recommended Content

Editors’ Picks

AUD/USD remained bid above 0.6500

AUD/USD remained bid above 0.6500

AUD/USD extended further its bullish performance, advancing for the fourth session in a row on Thursday, although a sustainable breakout of the key 200-day SMA at 0.6526 still remain elusive.

AUD/USD News

EUR/USD faces a minor resistance near at 1.0750

EUR/USD faces a minor resistance near at 1.0750

EUR/USD quickly left behind Wednesday’s small downtick and resumed its uptrend north of 1.0700 the figure, always on the back of the persistent sell-off in the US Dollar ahead of key PCE data on Friday.

EUR/USD News

Gold holds around $2,330 after dismal US data

Gold holds around $2,330 after dismal US data

Gold fell below $2,320 in the early American session as US yields shot higher after the data showed a significant increase in the US GDP price deflator in Q1. With safe-haven flows dominating the markets, however, XAU/USD reversed its direction and rose above $2,340.

Gold News

Bitcoin price continues to get rejected from $65K resistance as SEC delays decision on spot BTC ETF options

Bitcoin price continues to get rejected from $65K resistance as SEC delays decision on spot BTC ETF options

Bitcoin (BTC) price has markets in disarray, provoking a broader market crash as it slumped to the $62,000 range on Thursday. Meanwhile, reverberations from spot BTC exchange-traded funds (ETFs) continue to influence the market.

Read more

US economy: slower growth with stronger inflation

US economy: slower growth with stronger inflation

The dollar strengthened, and stocks fell after statistical data from the US. The focus was on the preliminary estimate of GDP for the first quarter. Annualised quarterly growth came in at just 1.6%, down from the 2.5% and 3.4% previously forecast.

Read more

Majors

Cryptocurrencies

Signatures