|

TSLA Leading Stocks Lower

The current price action and Elliott wave analysis suggest further declines for TSLA shares. Not even a full month into the new year TSLA shares have already seen 2 large declines. The first drop was blamed on a pricing adjustments for U.S. vehicles. The 2nd drop is being blamed over layoffs and unappealing guidance. Bearish traders seem to be piling on for lower prices with nearly 20% of the stock’s float being shorted. Options traders are also buying over 2 times the amount of puts to calls as of this article’s printing.

No doubt prices of the stock look to be going lower. We never admit to be fundamental exerts so as always here at EWF we look to the cycle, sequence, and Elliott wave analysis to forecast the next directional move of consequence. And, in this case, Elliott wave near term structural interpretations also call for a drop.

Since June of 2017 TSLA meandered sideways in a nearly $150 range. We now believe the stock is at an inflection point where prices can extend from the range. Current Elliott wave analysis suggests that break will be to the downside.

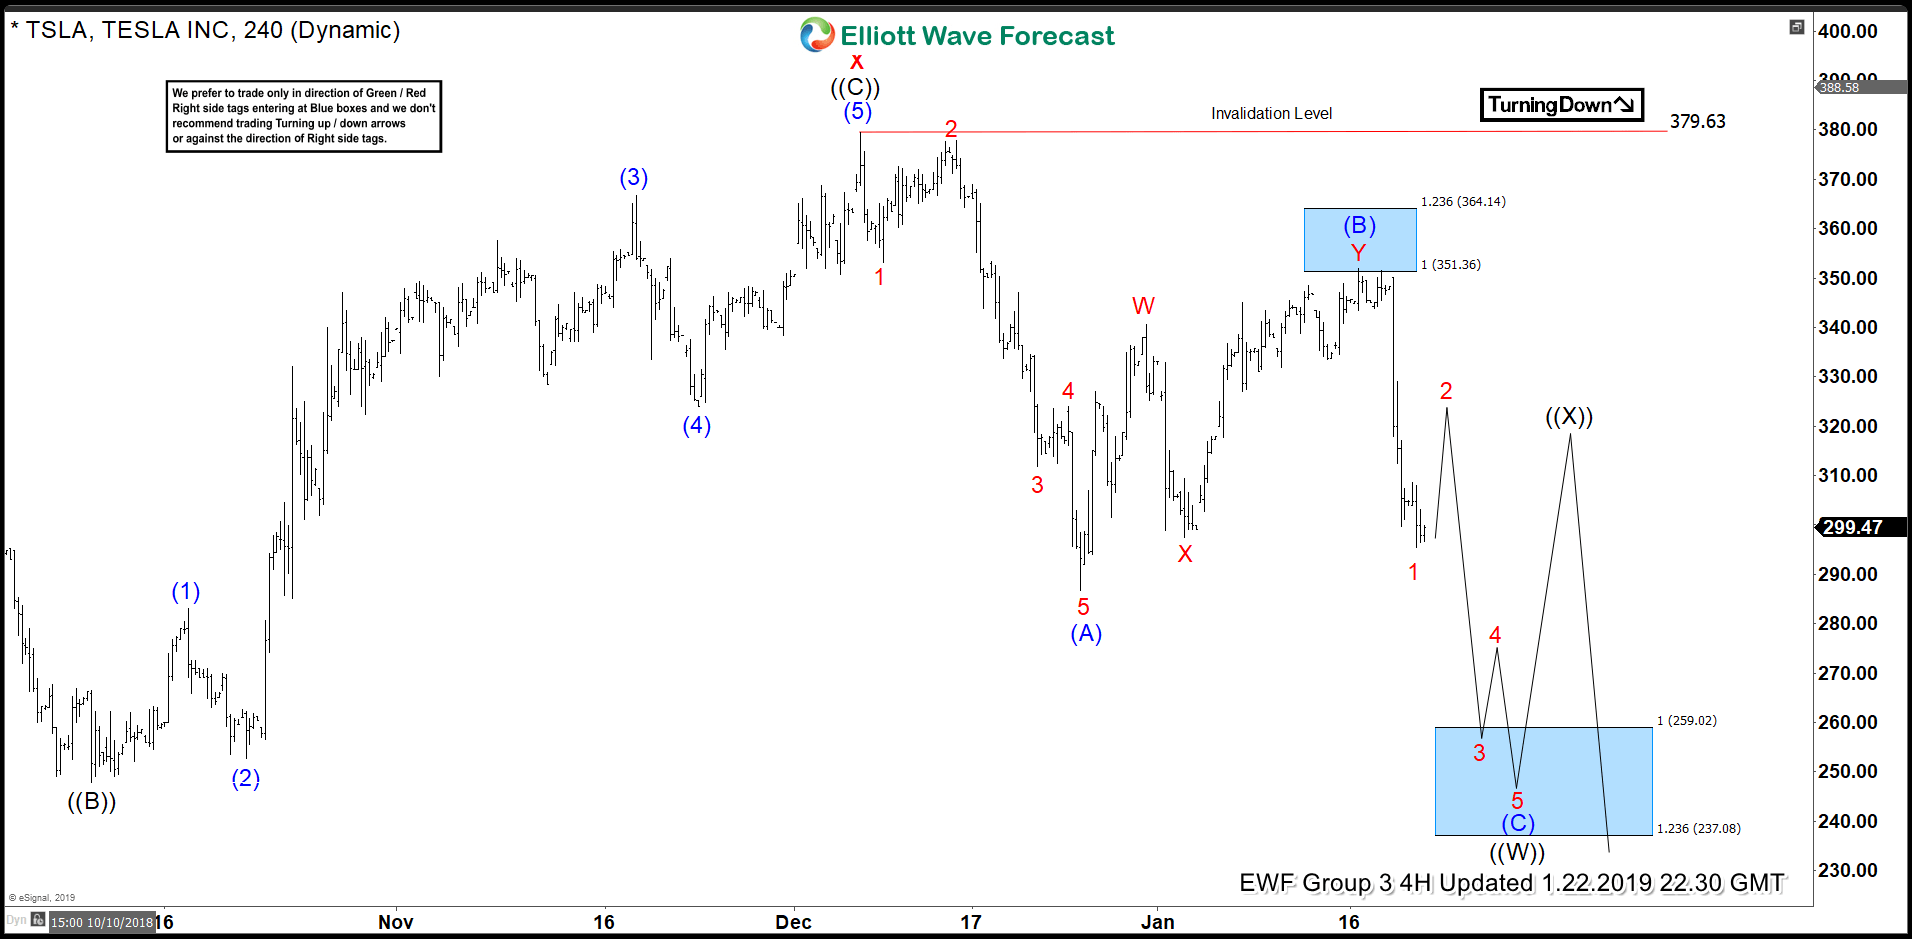
The Chart below is our latest 4hr interpretation of TSLA. While under the “x” wave (in red) high near 380 we see prices extending to at least 260. From there we can expect a bounce higher in 3 waves minimum. As long as this bounce remains under the “invalidation level” at the top of the chart the stock will be poised to move lower to levels not seen since early 2017 in the projected wave ((Y)).

TSLA


Author

Elliott Wave Forecast Team

Elliott Wave Forecast Team

ElliottWave-Forecast.com

More from Elliott Wave Forecast Team
Share:

Editor's Picks

EUR/USD: US Dollar to remain pressured until uncertainty fog dissipates

Unimpressive European Central Bank left monetary policy unchanged for the fifth consecutive meeting. The United States first-tier employment and inflation data is scheduled for the second week of February. EUR/USD battles to remain afloat above 1.1800, sellers moving to the sidelines.

GBP/USD reclaims 1.3600 and above

GBP/USD reverses two straight days of losses, surpassing the key 1.3600 yardstick on Friday. Cable’s rebound comes as the Greenback slips away from two-week highs in response to some profit-taking mood and speculation of Fed rate cuts. In addition, hawkish comments from the BoE’s Pill are also collaborating with the quid’s improvement.

Gold: Volatility persists in commodity space

After losing more than 8% to end the previous week, Gold remained under heavy selling pressure on Monday and dropped toward $4,400. Although XAU/USD staged a decisive rebound afterward, it failed to stabilize above $5,000. The US economic calendar will feature Nonfarm Payrolls and Consumer Price Index data for January, which could influence the market pricing of the Federal Reserve’s policy outlook and impact Gold’s performance.

Week ahead: US NFP and CPI data to shake Fed cut bets, Japan election looms

US NFP and CPI data awaited after Warsh’s nomination as Fed chief. Yen traders lock gaze on Sunday’s snap election. UK and Eurozone Q4 GDP data also on the agenda. China CPI and PPI could reveal more weakness in domestic demand.

Three scenarios for Japanese Yen ahead of snap election

The latest polls point to a dominant win for the ruling bloc at the upcoming Japanese snap election. The larger Sanae Takaichi’s mandate, the more investors fear faster implementation of tax cuts and spending plans. 

XRP rally extends as modest ETF inflows support recovery

Ripple is accelerating its recovery, trading above $1.36 at the time of writing on Friday, as investors adjust their positions following a turbulent week in the broader crypto market. The remittance token is up over 21% from its intraday low of $1.12.