Trump tariffs torpedo markets

USD: Dec '25 is Down at 98.595.
Energies: Dec '25 Crude is Down at 58.21.
Financials: The Dec '25 30 Year T-Bond is Higher by 7 ticks and trading at 118.16.
Indices: The Dec '25 S&P 500 emini ES contract is 160 ticks Higher and trading at 6727.00.
Gold: The Dec'25 Gold contract is trading Up at 4217.10.
Initial conclusion
This is not a correlated market. The USD is Down and Crude is Up which is normal, and the 30 Year T-Bond is trading Higher. The Financials should always correlate with the US dollar such that if the dollar is Higher, then the bonds should follow and vice-versa. The S&P is Higher and Crude is trading Lower which is correlated. Gold is trading Higher which is correlated with the US dollar trading Down. I tend to believe that Gold has an inverse relationship with the US Dollar as when the US Dollar is down, Gold tends to rise in value and vice-versa. Think of it as a seesaw, when one is up the other should be down. I point this out to you to make you aware that when we don't have a correlated market, it means something is wrong. As traders you need to be aware of this and proceed with your eyes wide open. All of Asia traded Higher. Currently all of Europe is trading Higher except the London exchange.
Possible challenges to traders
-
Empire State MFG Index is out at 8:30 AM EST. Major.
-
FOMC Member Miran Speaks at 9:30 AM EST. Major.
-
FOMC Member Miran Speaks at 12:30 PM EST. Major.
-
FOMC Member Waller Speaks at 1 PM EST. Major.
-
Fed Beige Book is out at 2 PM EST. Major.
-
FOMC Member Schmid Speaks at 2:30 PM EST. Major.
Traders, please note that we've changed the Bond instrument from the 10 Year (ZN) to the 2 Year (ZT). They work exactly the same.
We've elected to switch gears a bit and show correlation between the 2-year Treasury notes (ZT) and the S&P futures contract. The YM contract is the Dow Jones Industrial Average, and the purpose is to show reverse correlation between the two instruments. Remember it's likened to a seesaw, when up goes up the other should go down and vice versa.
Yesterday the ZT dived Lower at around 7:30 AM EST with no other economic news in sight. The Dow climbed Higher at the same time. Look at the charts below and you'll see a pattern for both assets. The Dow climbed Higher at around 7:30 AM EST and the ZT dived Lower at around the same time. These charts represent the newest version of Bar Charts, and I've changed the timeframe to a 15-minute chart to display better. This represented a Short opportunity on the 2-year note, as a trader you could have netted about a dozen ticks per contract on this trade. Each tick is worth $6.25. Please note: the front month for ZT is now Dec '25 and the Dow is now Dec '25. I've changed the format to filled Candlesticks (not hollow) such that it may be more apparent and visible.
Charts courtesy of BarCharts
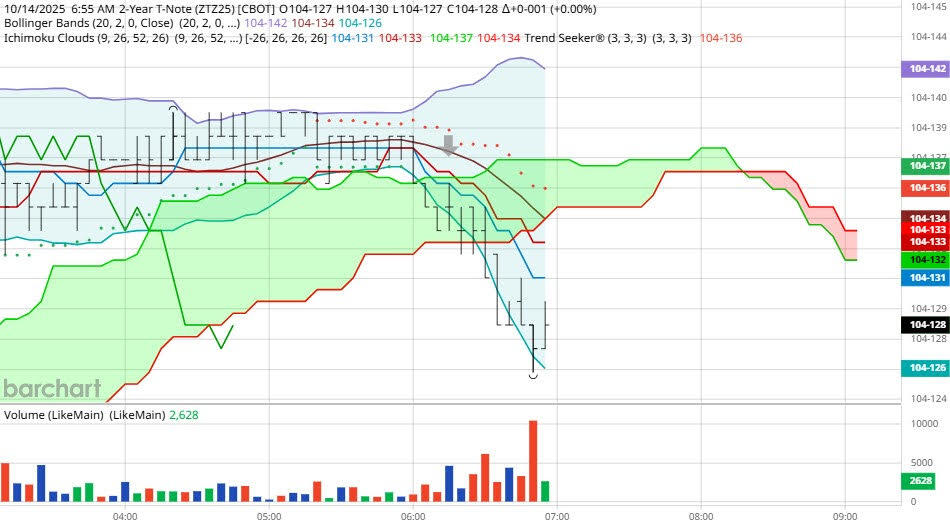
ZT -Sep 25 - 10/14/25
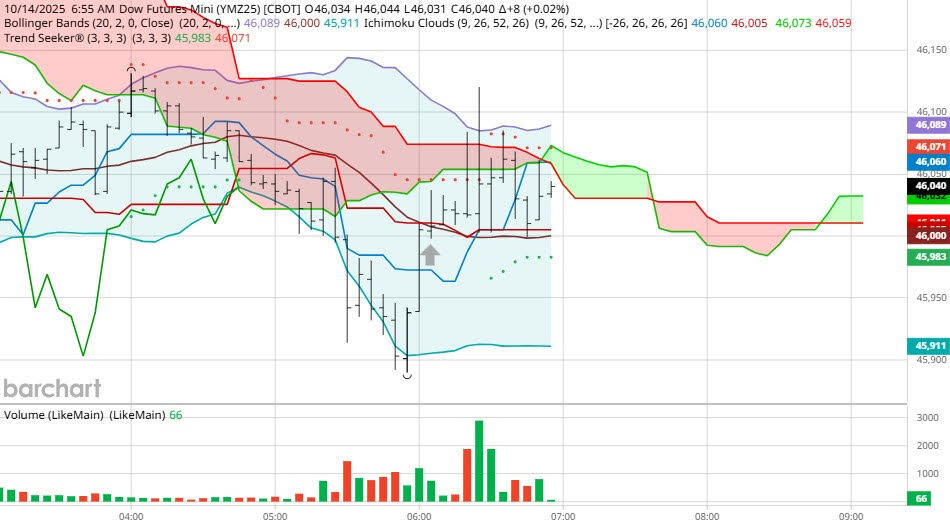
Dow - Sep 2025- 10/14/25
Bias
Yesterday we gave the markets a Downside bias, and for the most part the markets did veer Lower. The Dow opened far Lower than Monday's close but by the end of the session the Dow gained 203 points. Both the S&P and Nasdaq lost ground on Tuesday. Today we aren't dealing with a correlated market, and our bias is to the Upside.
Could this change? Of Course. Remember anything can happen in a volatile market.
Commentary
As it's often said in the markets what goes up, must come down. It appears that the upswing we saw on Monday did not follow thru on Tuesday. It seems that the President has solidified tariffs against China and the markets reacted accordingly. Want to learn Market Correlation and determine market direction hours before the Opening Bell?
Author

Nick Mastrandrea
Market Tea Leaves


