Good Morning Traders,

As of this writing 4 AM EST, here’s what we see:

US Dollar: Mar. USD is Up at 102.035.

Energies: February Crude is Up at 50.98.

Financials: The Mar 30 year bond is Up 4 ticks and trading at 152.21.

Indices: The March S&P 500 emini ES contract is 14 ticks Lower and trading at 2260.25.

Gold: The February gold contract is trading Up at 1190.40. Gold is 49 ticks Higher than its close.

Initial Conclusion

This is not a correlated market.  The dollar is Up+ and crude is Up+  which is not normal and the 30 year bond is trading Up+.  The Financials should always correlate with the US dollar such that if the dollar is lower then bonds should follow and vice-versa. The indices are Down- and Crude is trading Up+ which is correlated. Gold is trading Up which is not correlated with the US dollar trading Up. I tend to believe that Gold has an inverse relationship with the US Dollar as when the US Dollar is down, Gold tends to rise in value and vice-versa. Think of it as a seesaw, when one is up the other should be down. I point this out to you to make you aware that when we don’t have a correlated market, it means something is wrong. As traders you need to be aware of this and proceed with your eyes wide open.

Asia traded mainly higher with the exception of the Shanghai and Singapore exchanges which traded lower.  As of this writing all of Europe is trading lower.

Possible Challenges To Traders Today

–  Crude Oil Inventories is out at 10:30 AM.  This is major.

–  President-Elect Speaks at 11 AM EST.  This is major.

–  10-y Bond Auction starts at 1 PM EST.  This is major.

–  FOMC Member Dudley Speaks at 1:20 PM EST.  This is major.
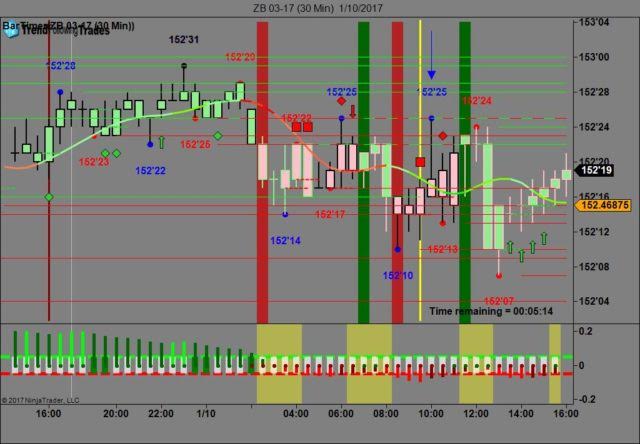
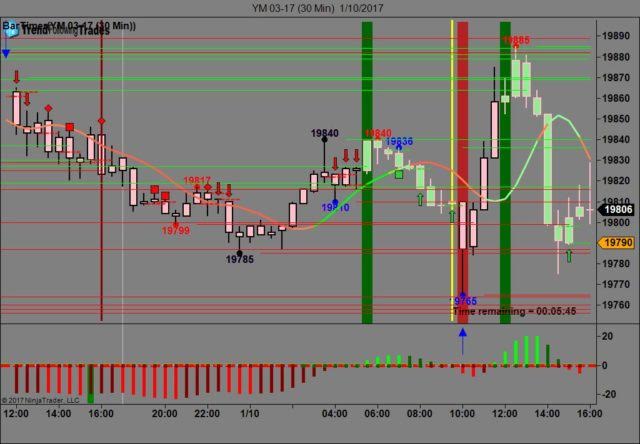
Treasuries

We’ve elected to switch gears a bit and show correlation between the 30 year bond (ZB) and The YM futures contract.  The YM contract is the DJIA and the purpose is to show reverse correlation between the two instruments.  Remember it’s liken to a seesaw, when up goes up the other should go down and vice versa.

Yesterday the ZB made it’s move at around 10 AM EST with with no real economic news in sight.  The ZB hit a high at around that time and the YM hit a low.  If you look at the charts below ZB gave a signal at around 10 AM EST and the YM was moving higher at the same time. Look at the charts below and you’ll see a pattern for both assets. ZB hit a high at around 10 AM EST and the YM hit a low.  These charts represent the newest version of Trend Following Trades and I’ve changed the timeframe to a 30 minute chart to display better.  This represented a shorting opportunity on the 30 year bond, as a trader you could have netted about 15 plus ticks per contract on this trade.  Each tick is worth $31.25.  We added a Donchian Channel to the charts to show the signals more clearly.

Charts Courtesy of Trend Following Trades built on a NinjaTrader platform.

ZB


YM

Bias

Yesterday we gave the markets a neutral bias as both the Bonds and the USD were both trading higher and ordinarily this would represent an upside bias, the indices  were all trading lower yesterday morning, hence the neutral bias.  The Dow closed 32 points lower, the S&P closed flat with no gain or loss and the Nasdaq traded 20 points higher; all in all a mixed or neutral day.  Today we aren’t dealing with a correlated market and our bias is to the downside.

Could this change? Of Course.  Remember anything can happen in a volatile market. 

Commentary

Yesterday we gave the markets a neutral bias as it seemed as though the markets could go in any direction and in fact they did!!!  The Dow opened lower, went higher, then went lower and finally closed 32 points lower.  On another note, yesterday we mentioned in our market bias video that Alcoa would report prior to the open.  This proved to be incorrect as Alcoa (for the 1st time) won’t be the first to report earnings but will do so on January 24th.

Trading performance displayed herein is hypothetical. The following Commodity Futures Trading Commission (CFTC) disclaimer should be noted.

Hypothetical performance results have many inherent limitations, some of which are described below. No representation is being made that any account will or is likely to achieve profits or losses similar to those shown.

In fact, there are frequently sharp differences between hypothetical performance results and the actual results subsequently achieved by any particular trading program. One of the limitations of hypothetical performance trading results is that they are generally prepared with the benefit of hindsight.

In addition, hypothetical trading does not involve financial risk, and no hypothetical trading record can completely account for the impact of financial risk in actual trading. For example, the ability to withstand losses or to adhere to a particular trading program in spite of trading losses are material points which can also adversely affect actual trading results.

There are numerous other factors related to the markets in general or to the implementation of any specific trading program which cannot be fully accounted for in the preparation of hypothetical performance results and all of which can adversely affect actual trading results.

Trading in the commodities markets involves substantial risk and YOU CAN LOSE A LOT OF MONEY, and thus is not appropriate for everyone. You should carefully consider your financial condition before trading in these markets, and only risk capital should be used.

In addition, these markets are often liquid, making it difficult to execute orders at desired prices. Also, during periods of extreme volatility, trading in these markets may be halted due to so-called “circuit breakers” put in place by the CME to alleviate such volatility. In the event of a trading halt, it may be difficult or impossible to exit a losing position.

Recommended Content


Recommended Content

Editors’ Picks

AUD/USD stands firm above 0.6500 with markets bracing for Aussie PPI, US inflation

AUD/USD stands firm above 0.6500 with markets bracing for Aussie PPI, US inflation

The Aussie Dollar begins Friday’s Asian session on the right foot against the Greenback after posting gains of 0.33% on Thursday. The AUD/USD advance was sponsored by a United States report showing the economy is growing below estimates while inflation picked up. The pair traded at 0.6518.

AUD/USD News

EUR/USD mired near 1.0730 after choppy Thursday market session

EUR/USD mired near 1.0730 after choppy Thursday market session

EUR/USD whipsawed somewhat on Thursday, and the pair is heading into Friday's early session near 1.0730 after a back-and-forth session and complicated US data that vexed rate cut hopes.

EUR/USD News

Gold soars as US economic woes and inflation fears grip investors

Gold soars as US economic woes and inflation fears grip investors

Gold prices advanced modestly during Thursday’s North American session, gaining more than 0.5% following the release of crucial economic data from the United States. GDP figures for the first quarter of 2024 missed estimates, increasing speculation that the US Fed could lower borrowing costs.

Gold News

Ethereum could remain inside key range as Consensys sues SEC over ETH security status

Ethereum could remain inside key range as Consensys sues SEC over ETH security status

Ethereum appears to have returned to its consolidating move on Thursday, canceling rally expectations. This comes after Consensys filed a lawsuit against the US SEC and insider sources informing Reuters of the unlikelihood of a spot ETH ETF approval in May.

Read more

Bank of Japan expected to keep interest rates on hold after landmark hike

Bank of Japan expected to keep interest rates on hold after landmark hike

The Bank of Japan is set to leave its short-term rate target unchanged in the range between 0% and 0.1% on Friday, following the conclusion of its two-day monetary policy review meeting for April. The BoJ will announce its decision on Friday at around 3:00 GMT.

Read more

Majors

Cryptocurrencies

Signatures