Trump Rally Keeps Rolling
Good Morning Traders,
As of this writing 4:10 AM EST, here’s what we see:
US Dollar: Mar. USD is Down at 99.870.
Energies: January Crude is Up at 50.05.
Financials: The Mar 30 year bond is Down 6 ticks and trading at 150.00.
Indices: The December S&P 500 emini ES contract is 3 ticks Lower and trading at 2236.00.
Gold: The December gold contract is trading Up at 1178.20. Gold is 7 ticks Higher than its close.
Initial Conclusion
This is not a correlated market. The dollar is Down- and crude is Up+ which is normal and the 30 year bond is trading Down. The Financials should always correlate with the US dollar such that if the dollar is lower then bonds should follow and vice-versa. The indices are Down and Crude is trading Up which is correlated. Gold is trading Up which is correlated with the US dollar trading Down. I tend to believe that Gold has an inverse relationship with the US Dollar as when the US Dollar is down, Gold tends to rise in value and vice-versa. Think of it as a seesaw, when one is up the other should be down. I point this out to you to make you aware that when we don’t have a correlated market, it means something is wrong. As traders you need to be aware of this and proceed with your eyes wide open.
Asia traded mainly Higher with the exception of the Singapore and Shanghai exchanges which traded fractionally lower. As of this writing all of Europe is trading Higher.
Possible Challenges To Traders Today
– Unemployment Claims is out at 8:30 AM EST. This is major.
– Natural Gas Storage is out at 10:30 AM EST. This is major.
Treasuries
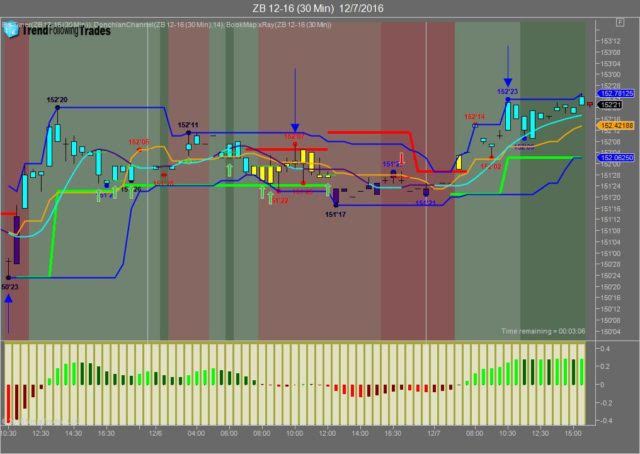
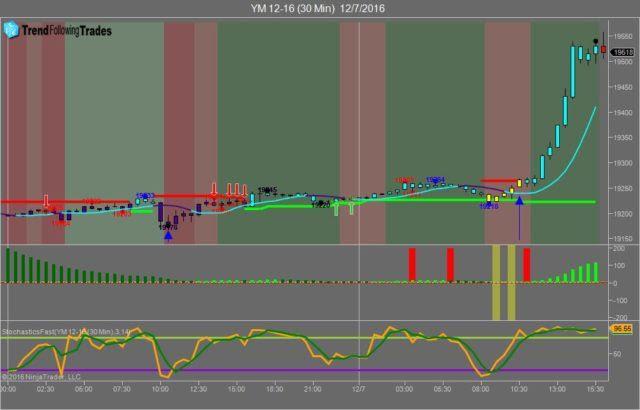
We’ve elected to switch gears a bit and show correlation between the 30 year bond (ZB) and The YM futures contract. The YM contract is the DJIA and the purpose is to show reverse correlation between the two instruments. Remember it’s liken to a seesaw, when up goes up the other should go down and vice versa.
Yesterday the ZB made it’s move at around 10:30 AM EST after the Crude Oil inventory numbers were released. The ZB hit a high at around that time and the YM hit a low. If you look at the charts below ZB gave a signal at around 10:30 AM EST and the YM was moving higher at the same time. Look at the charts below and you’ll see a pattern for both assets. ZB hit a high at around 10:30 AM EST and the YM hit a low. These charts represent the newest version of Trend Following Trades and I’ve changed the timeframe to a 30 minute chart to display better. This represented a shorting opportunity on the 30 year bond, as a trader you could have netted about 15 plus ticks per contract on this trade. Each tick is worth $31.25. We added a Donchian Channel to the charts to show the signals more clearly.
Charts Courtesy of Trend Following Trades built on a NinjaTrader platform
Bias
Yesterday we gave the markets a neutral bias which means it could go in any direction. But the Dow showed resiliency and strength and after 10 AM EST went to the upside and remained there throughout the session. The Dow gained 298 points and set a new closing record. The other indices gained ground as well. Today we aren’t dealing with a correlated market and our bias is to the upside.
Could this change? Of Course. Remember anything can happen in a volatile market.
Commentary
We can argue the point that the markets should be going a certain direction or not but the point remains that at this time and due in no small part to the election results, the markets want to go higher. Remember the old saying “if you can’t beat them”? Same analogy applies. It could be because everyone sees Trump as a proactive President. He hasn’t been sworn in yet and he’s helped the Carrier employees and has cut a deal with a Japanese firm to create 50,000 new jobs in the United States. Say what you will, this is unprecedented. The Donald may not yet be the supreme politician but no one can doubt his deal making ability. Today we have Unemployment Claims and Natural Gas Storage, both of which are major.
Author

Nick Mastrandrea
Market Tea Leaves


