Trump political risk subsiding as market sentiment improves

Market Overview
The political risk surrounding Donald Trump is beginning to subside, allowing market sentiment to improve once more. It is interesting to see markets beginning to look more settled early today as the agenda turns away from Trump’s domestic woes and more towards international trade deals. Trump is in the Middle East signing multi-billion dollar trade deals and it seems that his trip is going well. This is allowing the dollar to look more settles today after the selling pressure that took hold for much of last week. Yields on Treasuries are now picking up which is dollar supportive, whilst equities are also higher again today, whilst the VIX volatility is spiking back lower again. Safe haven plays such as the yen and gold are also weaker as risk sentiment improves.

Wall Street closed positively for a second straight day on Friday with the S&P 500 +0.6% at 2382. Asian markets have been positive overnight with the Nikkei +0.5%. European markets are also positive in early moves. In forex the dollar is stronger across the majors with one exception being a mildly outperformer in the Kiwi. Sterling is the struggler at the moment. Gold is lower with the dollar strength whilst oil continues to climb in front of this week’s crucial OPEC meeting.
Traders will see a very quiet start to the week when looking at the economic calendar. There are no key economic announcements due today, however there may be half an eye kept on the Eurogroup meeting of finance ministers which could impact on the euro.
Chart of the Day – AUD/USD
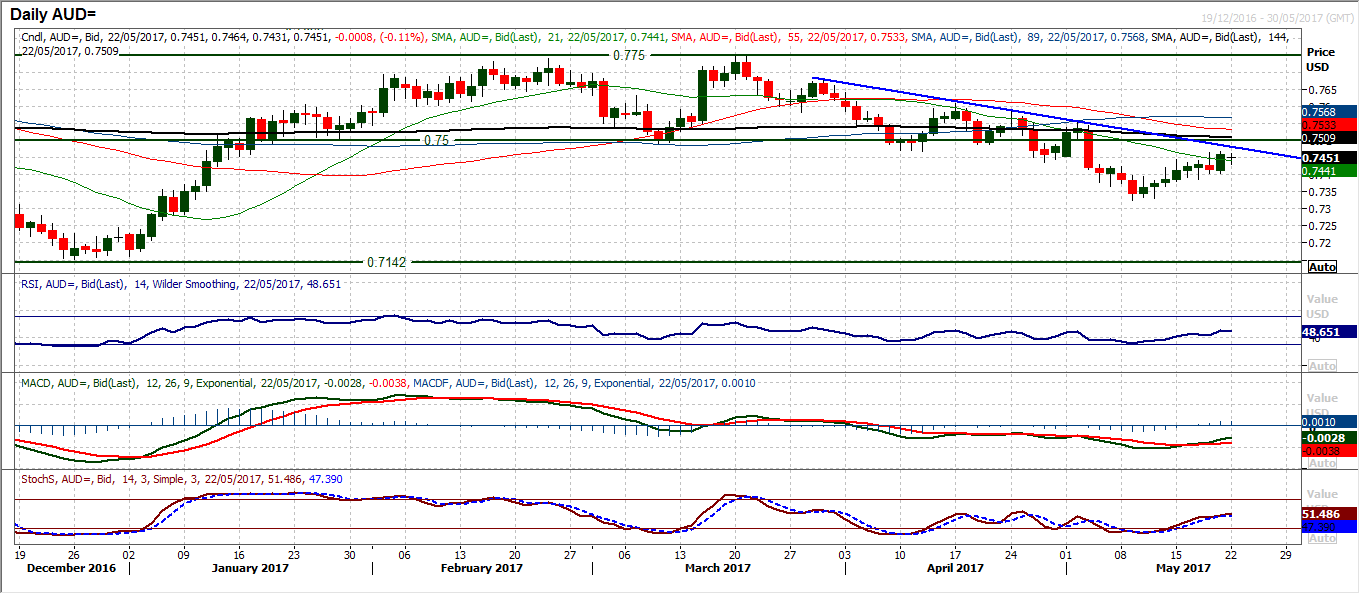
The US dollar has been under significant pressure in recent sessions and major currencies have performed well relatively. However the Aussie dollar is rallying from a low base and the medium term outlook for the Aussie is still bearish. The downtrend of the past seven weeks continues to track lower and comes in today at $0.7485. This downtrend now comes in below the key $0.7500 medium term breakdown of the multi-month top pattern that implies $0.7250 in the coming months. The RSI has been negatively configured for several weeks now, consistently failing around 50 whilst the Stochastics have a similar configuration. This all points towards using this Aussie rally as a chance to sell. There is resistance in the band $0.7435/$0.7500 that is overhead supply and throughout last week the intraday moves into this resistance continued to fail. There is a mildly positive bias to the hourly chart outlook, reflective of the recent rally, but with resistance looming overhead and an early dip back today, the bears will be eying the support of Friday’s low at around $0.7400 as an initial test. Furthermore, support of the higher reaction low at $0.7385 will be seen as key. A breach could re-open the downside in the coming days.
EUR/USD
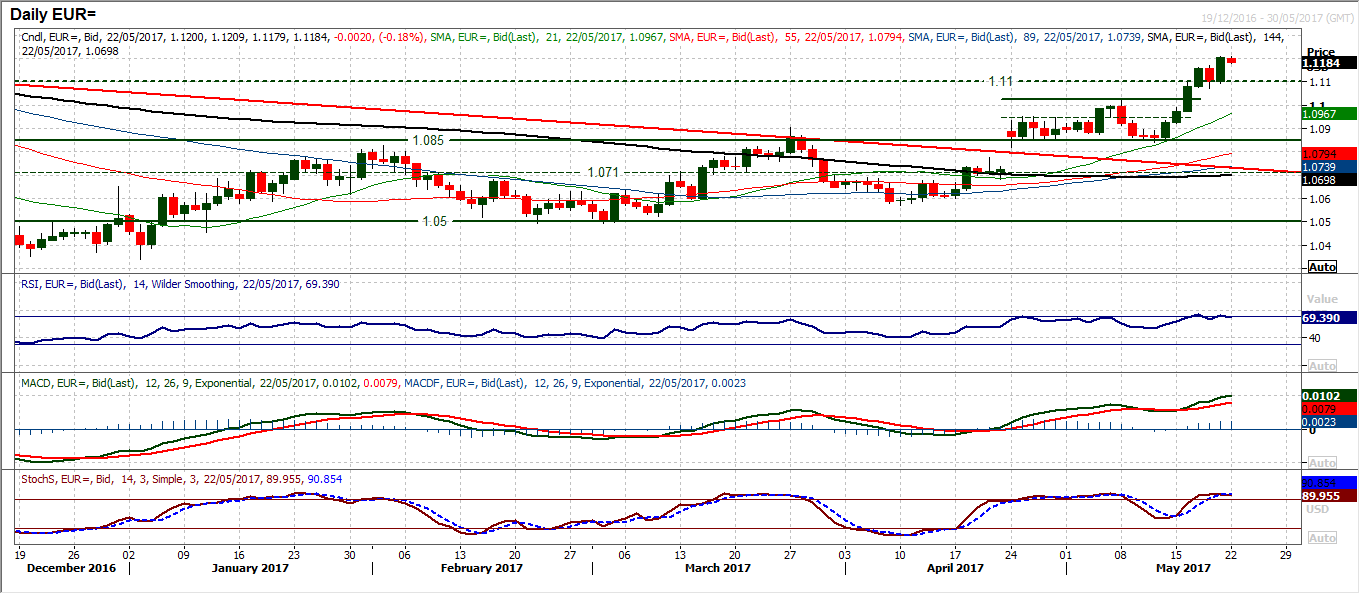
The euro bulls have quickly regained control once more with a strong bull candle that has again taken the euro to its highest level since 9th November. Momentum remains strong but stretched but currently every time the market taken even the smallest profit, the bulls return again. The RSI continues to hover around 70 which tends to be seen as historically stretched and limiting to immediate upside potential. The early moves again today are reflecting that as the euro has just come off the top slightly. However there is strengthening support around the long term pivot at $1.1100 before the breakout at $1.1022. The hourly chart shows a chart shows a market unwinding, with support $1.1140/$1.1170 initially. Above $1.1210 there is little real resistance until $1.1300.
GBP/USD
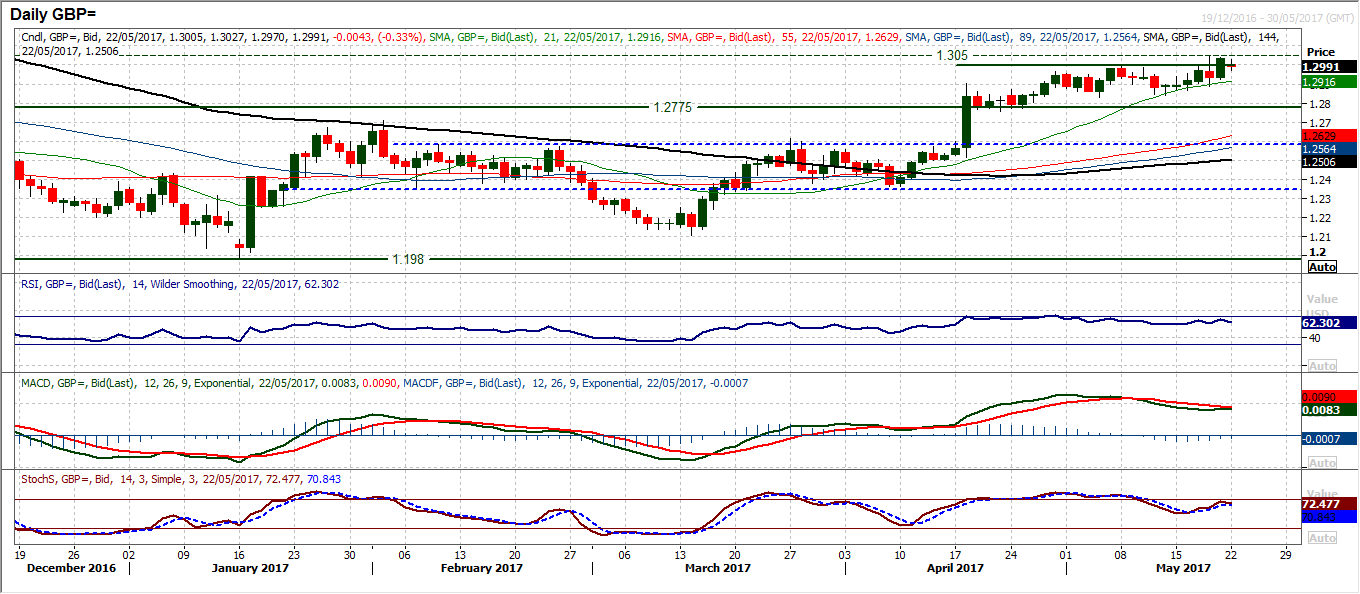
Resistance continues to be pressured whilst support holds at higher levels and the bulls remain in control. Friday’s strong bull candle was the first close above $1.3000 since early October and as there is likely to be further upside in due course. The momentum indicators are positively configured and having closed above $1.3000 this is a key barrier having been broken down. Corrections are being bought into and the hourly chart shows the hourly RSI consistently being supported between 35/50 and used as a chance to buy. There is initial support around $1.2960 and the early drop back this morning is likely to give another opportunity. The resistance at $1.3050 is from a couple of recent highs and an old pivot. Above would open $1.3120 and further recovery gains. Key support is at $1.2900.
USD/JPY
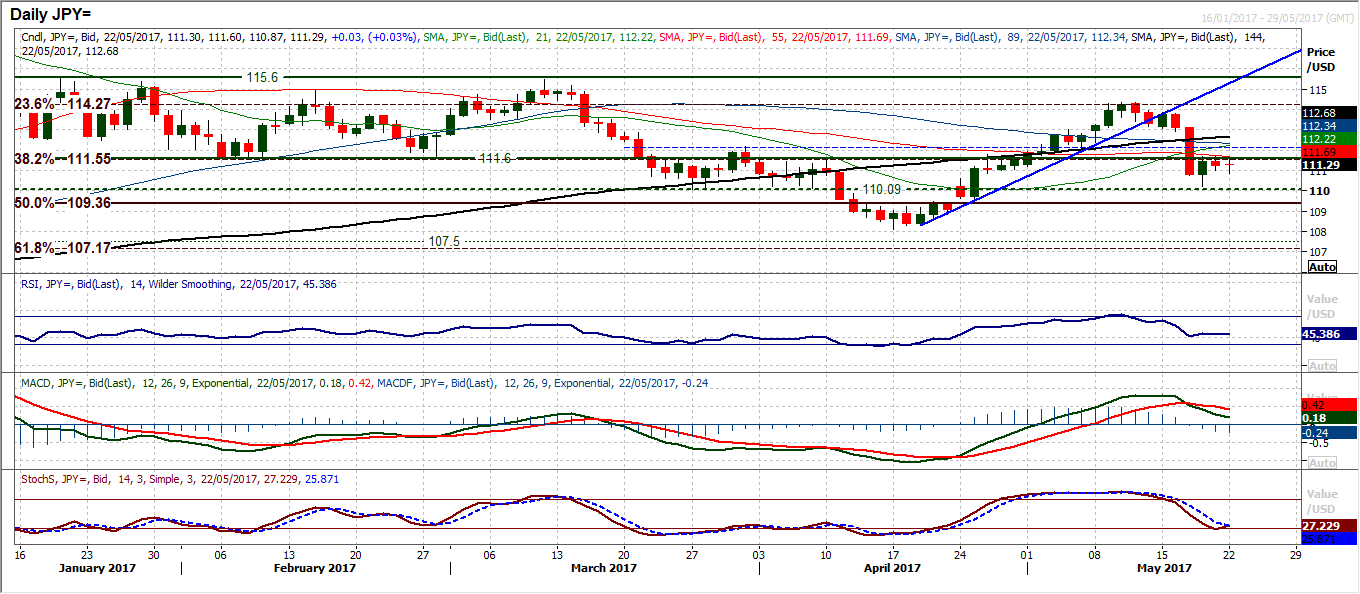
For a few months now there has been a key pivot around 111.60. This pivot has once more come back into play in the past few days as it has become a basis of resistance once more. The bulls have subsequently been held back in their recovery by the pivot which continues this morning. The momentum indicators have had their near term corrective drive quelled as the attempted recovery has taken hold but with this pivot preventing the recovery from gaining traction the market is finely balanced now. This is a market that could now go both ways as Friday’s candle and today’s move show little sign of decisive direction. This is reflected in the hourly chart with the MACD lines neutral and the RSI stuck under 60. There is a support from an early low at 110.87 and the resistance at 111.70 is growing. A breakout either way would drive direction. The bulls would have confirmation above 112.20. A close under 110.97 re-opens the support at 110.10.
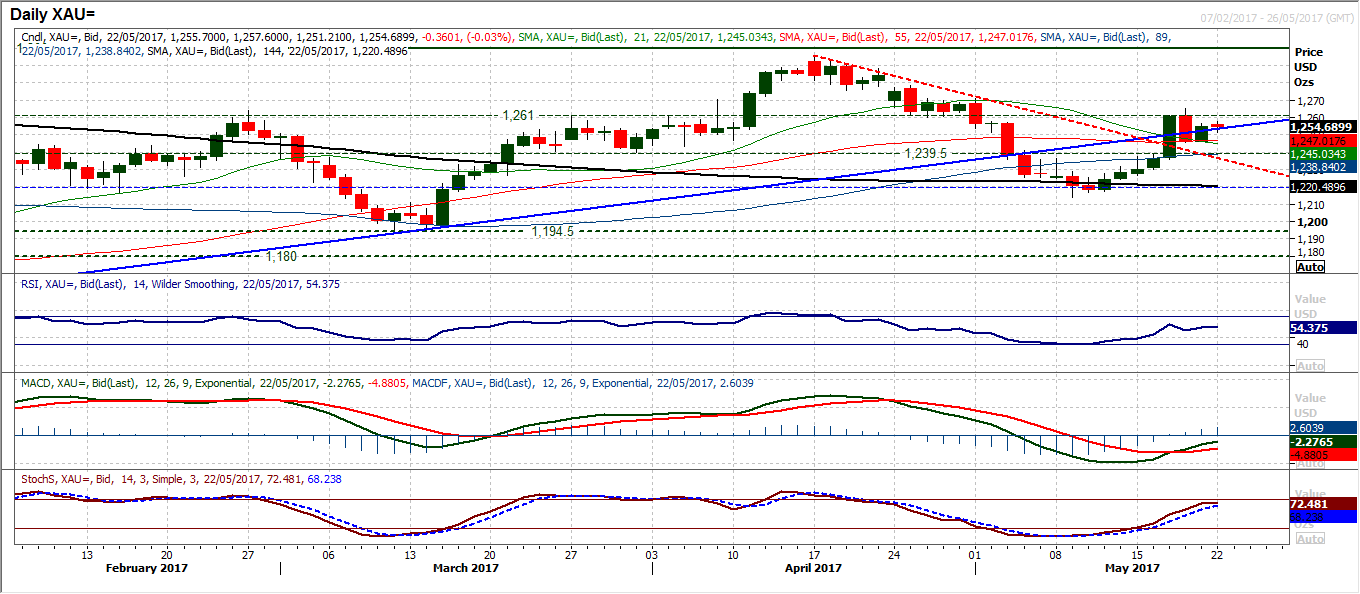
Gold
There is a more uncertain outlook forming as the chart develops a mixed phase of daily candles. There is a degree of settling down this morning after some volatility towards the backend of last week. This comes as the market continues to trade within the $1240/$1261 band that I see as more of a neutral zone. The momentum indicators are beginning to take on a more neutral configuration too. However, on the hourly chart there is still an uptrend that is intact from a move lasting eight sessions, however unless the market again looks to put pressure on the $1261 resistance this uptrend will begin to break and question the bull appetite. Initial support at $1245.
WTI Oil
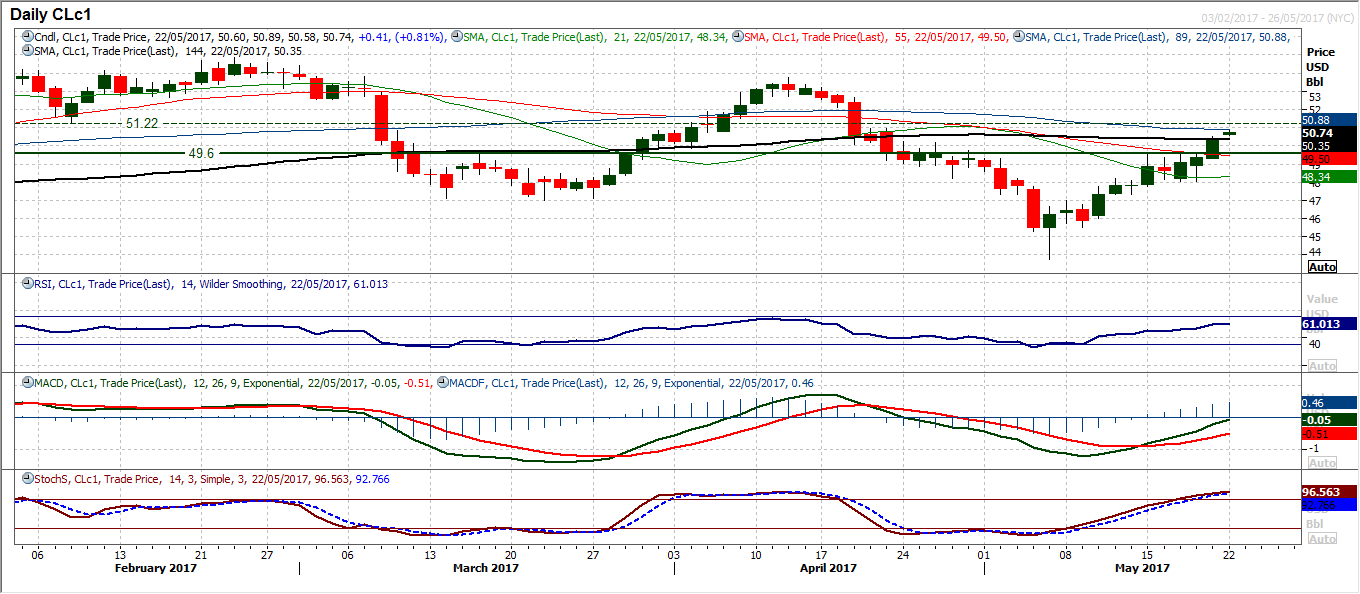
After several days testing the pivot resistance band $49.60/$50.20 oil has broken out. Both WTI and Brent Crude broke through their equivalent resistances on Friday (Brent Crude resistance was $53.00) and this continues the upside recovery. Momentum indicators continue to track higher and the bulls are increasingly in control of the near to medium term outlook. Recent history (the last three months) suggests that oil goes on these trends, both higher and lower and breaking through what has been a mid-range pivot is positive for the move higher in the coming days (i.e. at least in front of the OPEC decision on Wednesday). A move above 50.67/$50.93 means that there is little real resistance until the key April high at $53.75. The hourly chart shows there is now breakout support at $49.60 as initial buffer with the pivot now turning supportive.
Dow Jones Industrial Average
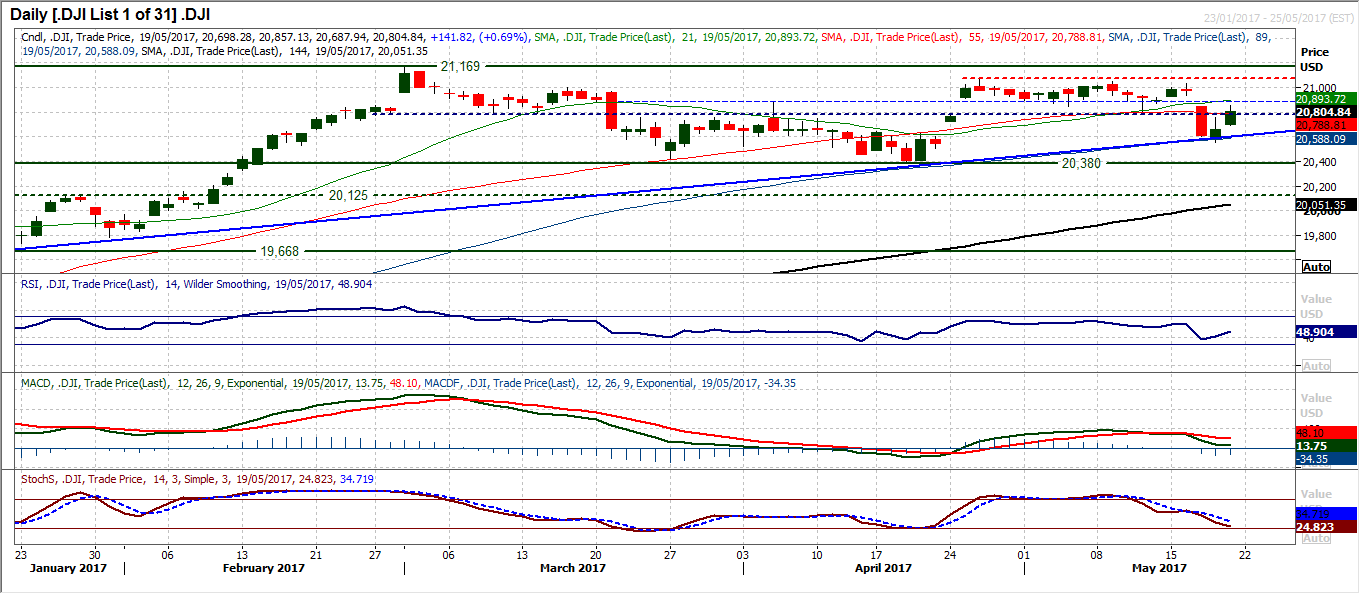
The Dow has rebounded well in the wake of Wednesday’s sell-off, to keep intact the uptrend since mid-January, however the move has simply unwound to the resistance between 20,780/20,887. The neckline of a small top pattern at 20,780 forms the basis of resistance and although Friday’s recovery was above this, it will play a role for the coming days. The current configuration to the momentum indicators suggests that there is still a corrective look to the near term outlook, however there are signs of stabilising as the MACD lines start to bottom. There is still a big breakdown gap that remains open at 20,933 and a failure under the 20,887 resistance early this week would question the bulls. However if the momentum of recovery in the past two days continues then the bulls will look at the resistance above 21,000 once more.
Author

Richard Perry
Independent Analyst


