Trump Inauguration Day
Good Morning Traders,
As of this writing 4:05 AM EST, here’s what we see:
US Dollar: Mar. USD is Down at 101.095.
Energies: February Crude is Up at 52.35.
Financials: The Mar 30 year bond is Down 10 ticks and trading at 150.24.
Indices: The March S&P 500 emini ES contract is 16 ticks Higher and trading at 2265.50.
Gold: The February gold contract is trading Up at 1203.00. Gold is 15 ticks Higher than its close.
Initial Conclusion
This is not a correlated market. The dollar is Down- and crude is Up+ which is normal and the 30 year bond is trading Down-. The Financials should always correlate with the US dollar such that if the dollar is lower then bonds should follow and vice-versa. The indices are Up+ and Crude is trading Up+ which is not correlated. Gold is trading Up which is correlated with the US dollar trading Down. I tend to believe that Gold has an inverse relationship with the US Dollar as when the US Dollar is down, Gold tends to rise in value and vice-versa. Think of it as a seesaw, when one is up the other should be down. I point this out to you to make you aware that when we don’t have a correlated market, it means something is wrong. As traders you need to be aware of this and proceed with your eyes wide open.
Asia traded mixed with half the exchanges higher and the other half lower. As of this writing Europe is trading Higher with the exception of the London exchange which is fractionally lower.
Possible Challenges To Traders Today
– FOMC Member Harker Speaks at 9 AM EST. This is major.
– President-Elect Trump Speaks. This is major.
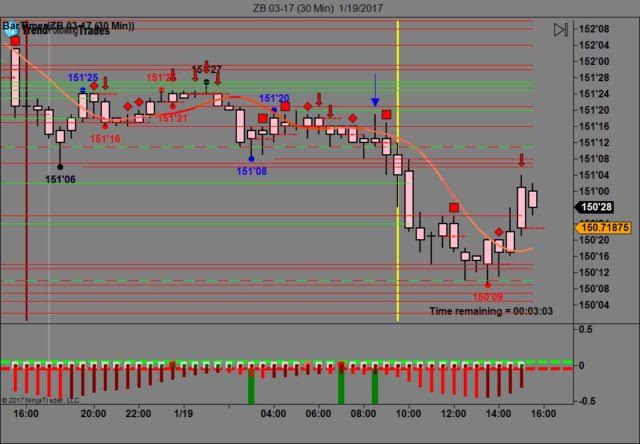
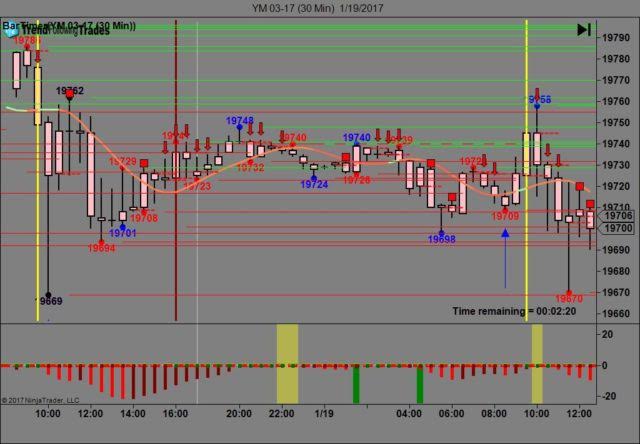
Treasuries
We’ve elected to switch gears a bit and show correlation between the 30 year bond (ZB) and The YM futures contract. The YM contract is the DJIA and the purpose is to show reverse correlation between the two instruments. Remember it’s liken to a seesaw, when up goes up the other should go down and vice versa.
Yesterday the ZB made it’s move at around 8:30 AM EST at around the time the 8:30 AM news came out. The ZB hit a high at around that time and the YM hit a low. If you look at the charts below ZB gave a signal at around 8:30 AM EST and the YM was moving higher at the same time. Look at the charts below and you’ll see a pattern for both assets. ZB hit a high at around 8:30 AM EST and the YM hit a low. These charts represent the newest version of Trend Following Trades and I’ve changed the timeframe to a 30 minute chart to display better. This represented a shorting opportunity on the 30 year bond, as a trader you could have netted about 30 plus ticks per contract on this trade. Each tick is worth $31.25. We added a Donchian Channel to the charts to show the signals more clearly.
Charts Courtesy of Trend Following Trades built on a NinjaTrader platform.
Bias
Yesterday we gave the markets a neutral bias as both the Bonds and Gold were trading lower and this should have signaled an upside bias for the markets. The only problem? The futures were also trading lower yesterday morning hence the neutral bias. The Dow closed lower by 72 points and the other indices lost ground as well. Remember that a neutral bias means the markets could go in any direction. Today given that it is Inauguration Day, we will maintain a neutral bias.
Could this change? Of Course. Remember anything can happen in a volatile market.
Commentary
Well today we finally get to hear what President Trump has in mind and I’m hoping that he’s finally going to reveal his plans and specifically how he going to do all that he’s promised on the campaign trail. The one aspect that’s always bothered me about Trump is he has never revealed the mechanics of how he’s going to do what he says he’ll do. Case-in-point Obamacare. He says he’s going to repeal it but what is he going to replace it with? Will he at least allow a one to two year window to get acclimated to another plan? He’s not saying and I suspect that one of the reasons as to why the market’ have been shaky as of late is because he’s short on details and this in effect causing anxiety. Will this and can this change in the time to come? I certainly hope so but as in all things only time will tell.
Author

Nick Mastrandrea
Market Tea Leaves


