Trump Express Still on Track
Good Morning Traders,
As of this writing 3:10 AM EST, here’s what we see:
US Dollar: Mar. USD is Up at 101.035.
Energies: January Crude is Up at 51.22.
Financials: The Mar 30 year bond is Down 24 ticks and trading at 149.07.
Indices: The December S&P 500 emini ES contract is 7 ticks Lower and trading at 2246.00.
Gold: The December gold contract is trading Down at 1170.20. Gold is 22 ticks Lower than its close.
Initial Conclusion
This is not a correlated market. The dollar is Up+ and crude is Up+ which is not normal but the 30 year bond is trading Down. The Financials should always correlate with the US dollar such that if the dollar is lower then bonds should follow and vice-versa. The indices are Down and Crude is trading Up which is correlated. Gold is trading Down which is correlated with the US dollar trading Up. I tend to believe that Gold has an inverse relationship with the US Dollar as when the US Dollar is down, Gold tends to rise in value and vice-versa. Think of it as a seesaw, when one is up the other should be down. I point this out to you to make you aware that when we don’t have a correlated market, it means something is wrong. As traders you need to be aware of this and proceed with your eyes wide open.
Asia traded mainly Higher with the exception of the Singapore and Hang Seng exchanges which traded fractionally lower. As of this writing all of Europe is trading Higher.
Possible Challenges To Traders Today
– Prelim UoM Consumer Sentiment is out at 10 AM. This is major.
– Prelim UoM Inflation Expectations is out at 10 AM. This is major.
– Final Wholesale Inventories m/m is out at 10 AM EST. This is not major.
Treasuries
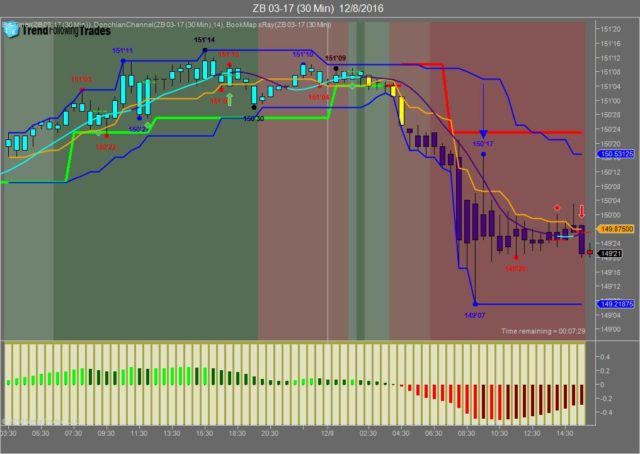
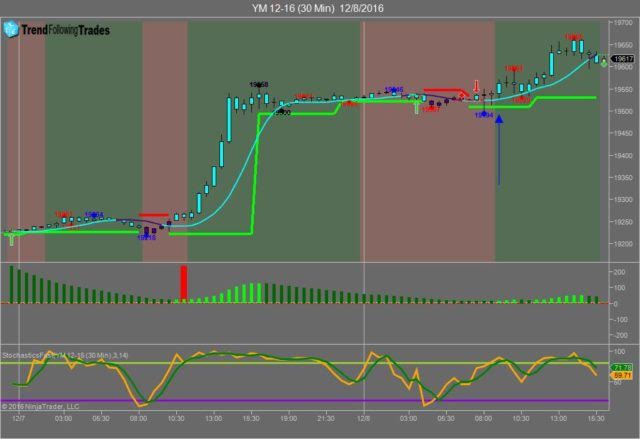
We’ve elected to switch gears a bit and show correlation between the 30 year bond (ZB) and The YM futures contract. The YM contract is the DJIA and the purpose is to show reverse correlation between the two instruments. Remember it’s liken to a seesaw, when up goes up the other should go down and vice versa.
Yesterday the ZB made it’s move at around 9 AM EST after the Unemployment Claims numbers came out. The ZB hit a high at around that time and the YM hit a low. If you look at the charts below ZB gave a signal at around 9 AM EST and the YM was moving higher at the same time. Look at the charts below and you’ll see a pattern for both assets. ZB hit a high at around 9 AM EST and the YM hit a low. These charts represent the newest version of Trend Following Trades and I’ve changed the timeframe to a 30 minute chart to display better. This represented a shorting opportunity on the 30 year bond, as a trader you could have netted about 25 plus ticks per contract on this trade. Each tick is worth $31.25. We added a Donchian Channel to the charts to show the signals more clearly.
Charts Courtesy of Trend Following Trades built on a NinjaTrader platform
Bias
Yesterday we gave the markets an upside bias and they did not disappoint as the Dow rose 65 points and the other indices gained ground as well. Today we aren’t dealing with a correlated market and our bias is neutral.
Could this change? Of Course. Remember anything can happen in a volatile market.
Commentary
Yesterday we said the markets would go higher and they did and the only thing we did was to follow our rules of market correlation. Yesterday morning both the USD and the Bonds were trading lower and this is indicative of an upside day on the indices themselves. Of course having very tame unemployment claims didn’t hurt either. Today we don’t have much on the economic calendar to drive the markets in any direction but we have to admire the resiliency of this market since Election Day. It has been nothing short of astounding. As traders we can’t deny this and of course we’ll take it as long as it lasts and it could conceivably be this way until Inauguration Day but as in all things, only time will tell.
Author

Nick Mastrandrea
Market Tea Leaves


