Trump Bump: 3 and counting…

Good Morning Traders,
As of this writing 4 AM EST, here’s what we see:
US Dollar: Mar. USD is Down at 100.735.
Energies: March Crude is Up at 53.14.
Financials: The Mar 30 year bond is Down 5 ticks and trading at 151.07.
Indices: The March S&P 500 emini ES contract is 6 ticks Lower and trading at 2324.75.
Gold: The April gold contract is trading Up at 1229.60. Gold is 38 ticks Higher than its close.
Initial Conclusion
This is not a correlated market. The dollar is Down- and crude is Up+ which is normal and the 30 year bond is trading Lower. The Financials should always correlate with the US dollar such that if the dollar is lower then bonds should follow and vice-versa. The indices are Down and Crude is trading Up+ which is correlated. Gold is trading Up which is correlated with the US dollar trading Down. I tend to believe that Gold has an inverse relationship with the US Dollar as when the US Dollar is down, Gold tends to rise in value and vice-versa. Think of it as a seesaw, when one is up the other should be down. I point this out to you to make you aware that when we don’t have a correlated market, it means something is wrong. As traders you need to be aware of this and proceed with your eyes wide open.
Asia traded mainly lower with the exception of the Aussie and Shanghai exchanges which traded higher. As of this writing all of Europe is trading lower.
Possible Challenges To Traders Today
– NFIB Small Business Index is out at 6 AM EST. This is not major.
– PPI m/m is out at 8:30 AM EST. This is major.
– Core PPI m/m is out at 8:30 AM EST. This is major.
– Fed Chair Yellen Speaks at 10 AM EST. This is major.
– Fed Monetary Policy Report is out at 10 AM EST. This is major.
– FOMC Member Kaplan Speaks at 1 PM EST. This is major.
Treasuries
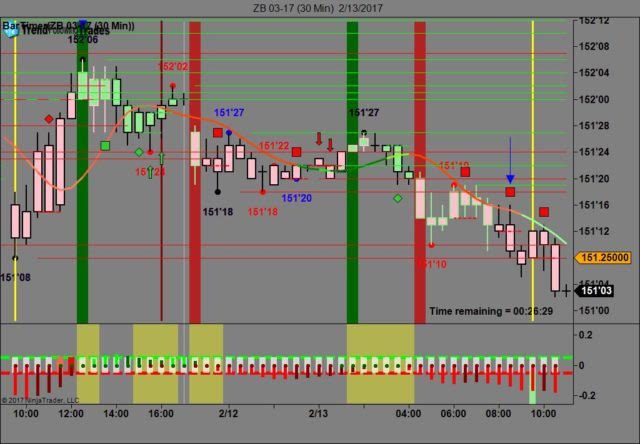
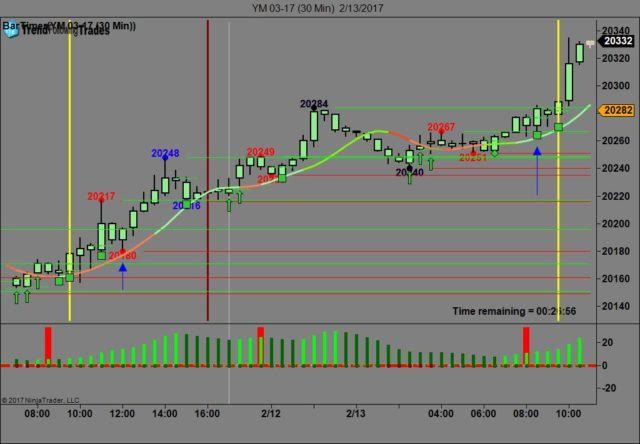
We’ve elected to switch gears a bit and show correlation between the 30 year bond (ZB) and The YM futures contract. The YM contract is the DJIA and the purpose is to show reverse correlation between the two instruments. Remember it’s liken to a seesaw, when up goes up the other should go down and vice versa.
On Friday the ZB made it’s move at around 8:30 AM EST with no economic news in sight. The ZB hit a high at around that time and the YM hit a low. If you look at the charts below ZB gave a signal at around 8:30 AM and the YM was moving higher at the same time. Look at the charts below and you’ll see a pattern for both assets. ZB hit a high at around 8:30 AM EST and the YM hit a low. These charts represent the newest version of Trend Following Trades and I’ve changed the timeframe to a 30 minute chart to display better. This represented a shorting opportunity on the 30 year bond, as a trader you could have netted about 15 ticks per contract on this trade. Each tick is worth $31.25. We added a Donchian Channel to the charts to show the signals more clearly.
Charts Courtesy of Trend Following Trades built on a NinjaTrader platform
Bias
Yesterday we gave the markets an upside bias as both the Bonds and Gold were trading higher and this usually results in an upside day. Monday was no exception to that rule as the Dow traded 143 points higher and the other indices gained ground as well. Today we aren’t dealing with a correlated market and our bias is neutral.
Could this change? Of Course. Remember anything can happen in a volatile market.
Commentary
Once again the Trump rally is in high gear as the Dow moved much higher yesterday gaining 143 points and the other indices moved higher as well. Today we have Janet Yellen giving her testimony to a Congressional Committee today and will continue to do so tomorrow as well. We hope that the Fed will downplay the idea of rate hikes as this market is just starting to see light at the end of the tunnel and rate hikes is a surefire way to throw a monkey wrench into the mix.
Author

Nick Mastrandrea
Market Tea Leaves


