Truce At Last?? [Video]
![Truce At Last?? [Video]](https://editorial.fxstreet.com/images/Markets/Commodities/Metals/Gold/gold-gm187363896-28836378_XtraLarge.jpg)
Good Morning Traders,
As of this writing 4:50 AM EST, here's what we see:
US Dollar: Dec USD is Up at 98.170.
Energies: Nov '19 Crude is Down at 54.26.
Financials: The Dec 30 year bond is Up 25 ticks and trading at 161.07.
Indices: The Dec S&P 500 emini ES contract is 4 ticks Higher and trading at 2969.75.
Gold: The Dec Gold contract is trading Up at 1493.50. Gold is 48 ticks Higher than its close.
Initial Conclusion
This is not a correlated market. The dollar is Down- and Crude is Down- which is normal and the 30 year Bond is trading Lower. The Financials should always correlate with the US dollar such that if the dollar is lower then bonds should follow and vice-versa. The S&P is Lower and Crude is trading Lower which is not correlated. Gold is trading Higher which is correlated with the US dollar trading Down. I tend to believe that Gold has an inverse relationship with the US Dollar as when the US Dollar is down, Gold tends to rise in value and vice-versa. Think of it as a seesaw, when one is up the other should be down. I point this out to you to make you aware that when we don't have a correlated market, it means something is wrong. As traders you need to be aware of this and proceed with your eyes wide open.
At this time all of Asia is trading Higher. Currently all of Europe is trading Lower.
Possible Challenges To Traders Today
· Columbus Day Bank Holiday.
· No major economic news.
· Lack of major economic news.
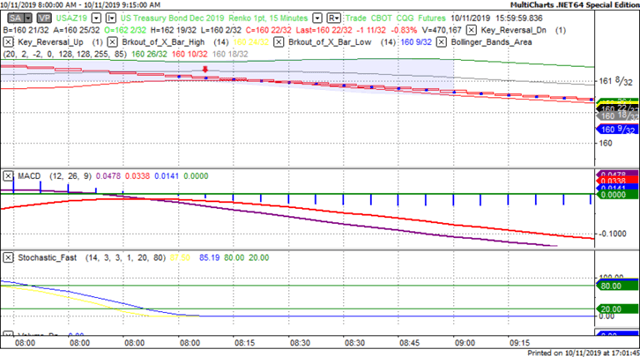
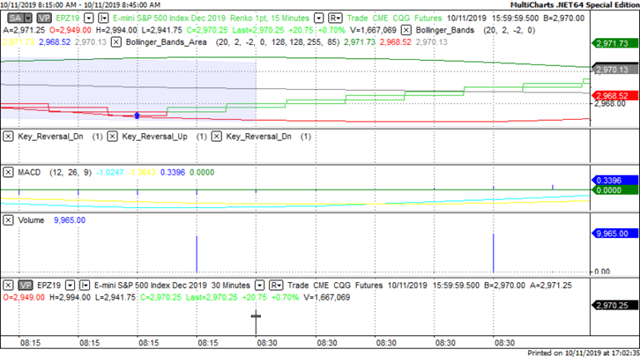
Treasuries
We've elected to switch gears a bit and show correlation between the 30 year bond (ZB) and The S&P futures contract. The S&P contract is the Standard and Poor's and the purpose is to show reverse correlation between the two instruments. Remember it's liken to a seesaw, when up goes up the other should go down and vice versa.
On Friday the ZB made a major move at around 8:15 AM EST. The ZB hit a High at around that time and the S&P hit a Low. If you look at the charts below ZB gave a signal at around 8:15 AM EST and the S&P was moving Higher at the same time. Look at the charts below and you'll see a pattern for both assets. ZB hit a High at around 8:15 AM and the S&P was moving Higher at the same time. These charts represent the newest version of MultiCharts and I've changed the timeframe to a 15 minute chart to display better. This represented a Shorting opportunity on the 30 year bond, as a trader you could have netted about 20 plus ticks per contract on this trade. Each tick is worth $31.25. Please note: the front month for the ZB is now December. The S&P contract is now at December as well and I've changed the format to Renko bars such that it may be more apparent and visible.
Charts Courtesy of MultiCharts built on an AMP platform
Bias
On Friday we gave the markets an Upside bias as both the USD and the Bonds were trading Lower Friday morning and this is generally indicative of an Upside Day. The markets didn't disappoint as the Dow gained 320 points and the other indices gained ground as well. Today we aren't dealing with a correlated market and our bias is to the Downside.
Could this change? Of Course. Remember anything can happen in a volatile market.
Commentary
So Thursday evening we heard rumors that the proposed talks with China was to resume on Friday and for once the rumor proved to be fact as trade talks did resume. The markets took this as a positive given the announcement that proposed tariffs that were scheduled to go into effect October 15th won't be. All in all this proved to be a positive day for the markets as the Dow alone jumped 320 points. The other indices gained ground as well. Being that today is Columbus Day in the US the bank s are closed and there is no major economic news being reported.
Author

Nick Mastrandrea
Market Tea Leaves


