Triangle trap – Gold’s next move Elliott Wave analysis

Gold's range since April 2024
-
Upside: 2455.
-
Lower side: 2285.
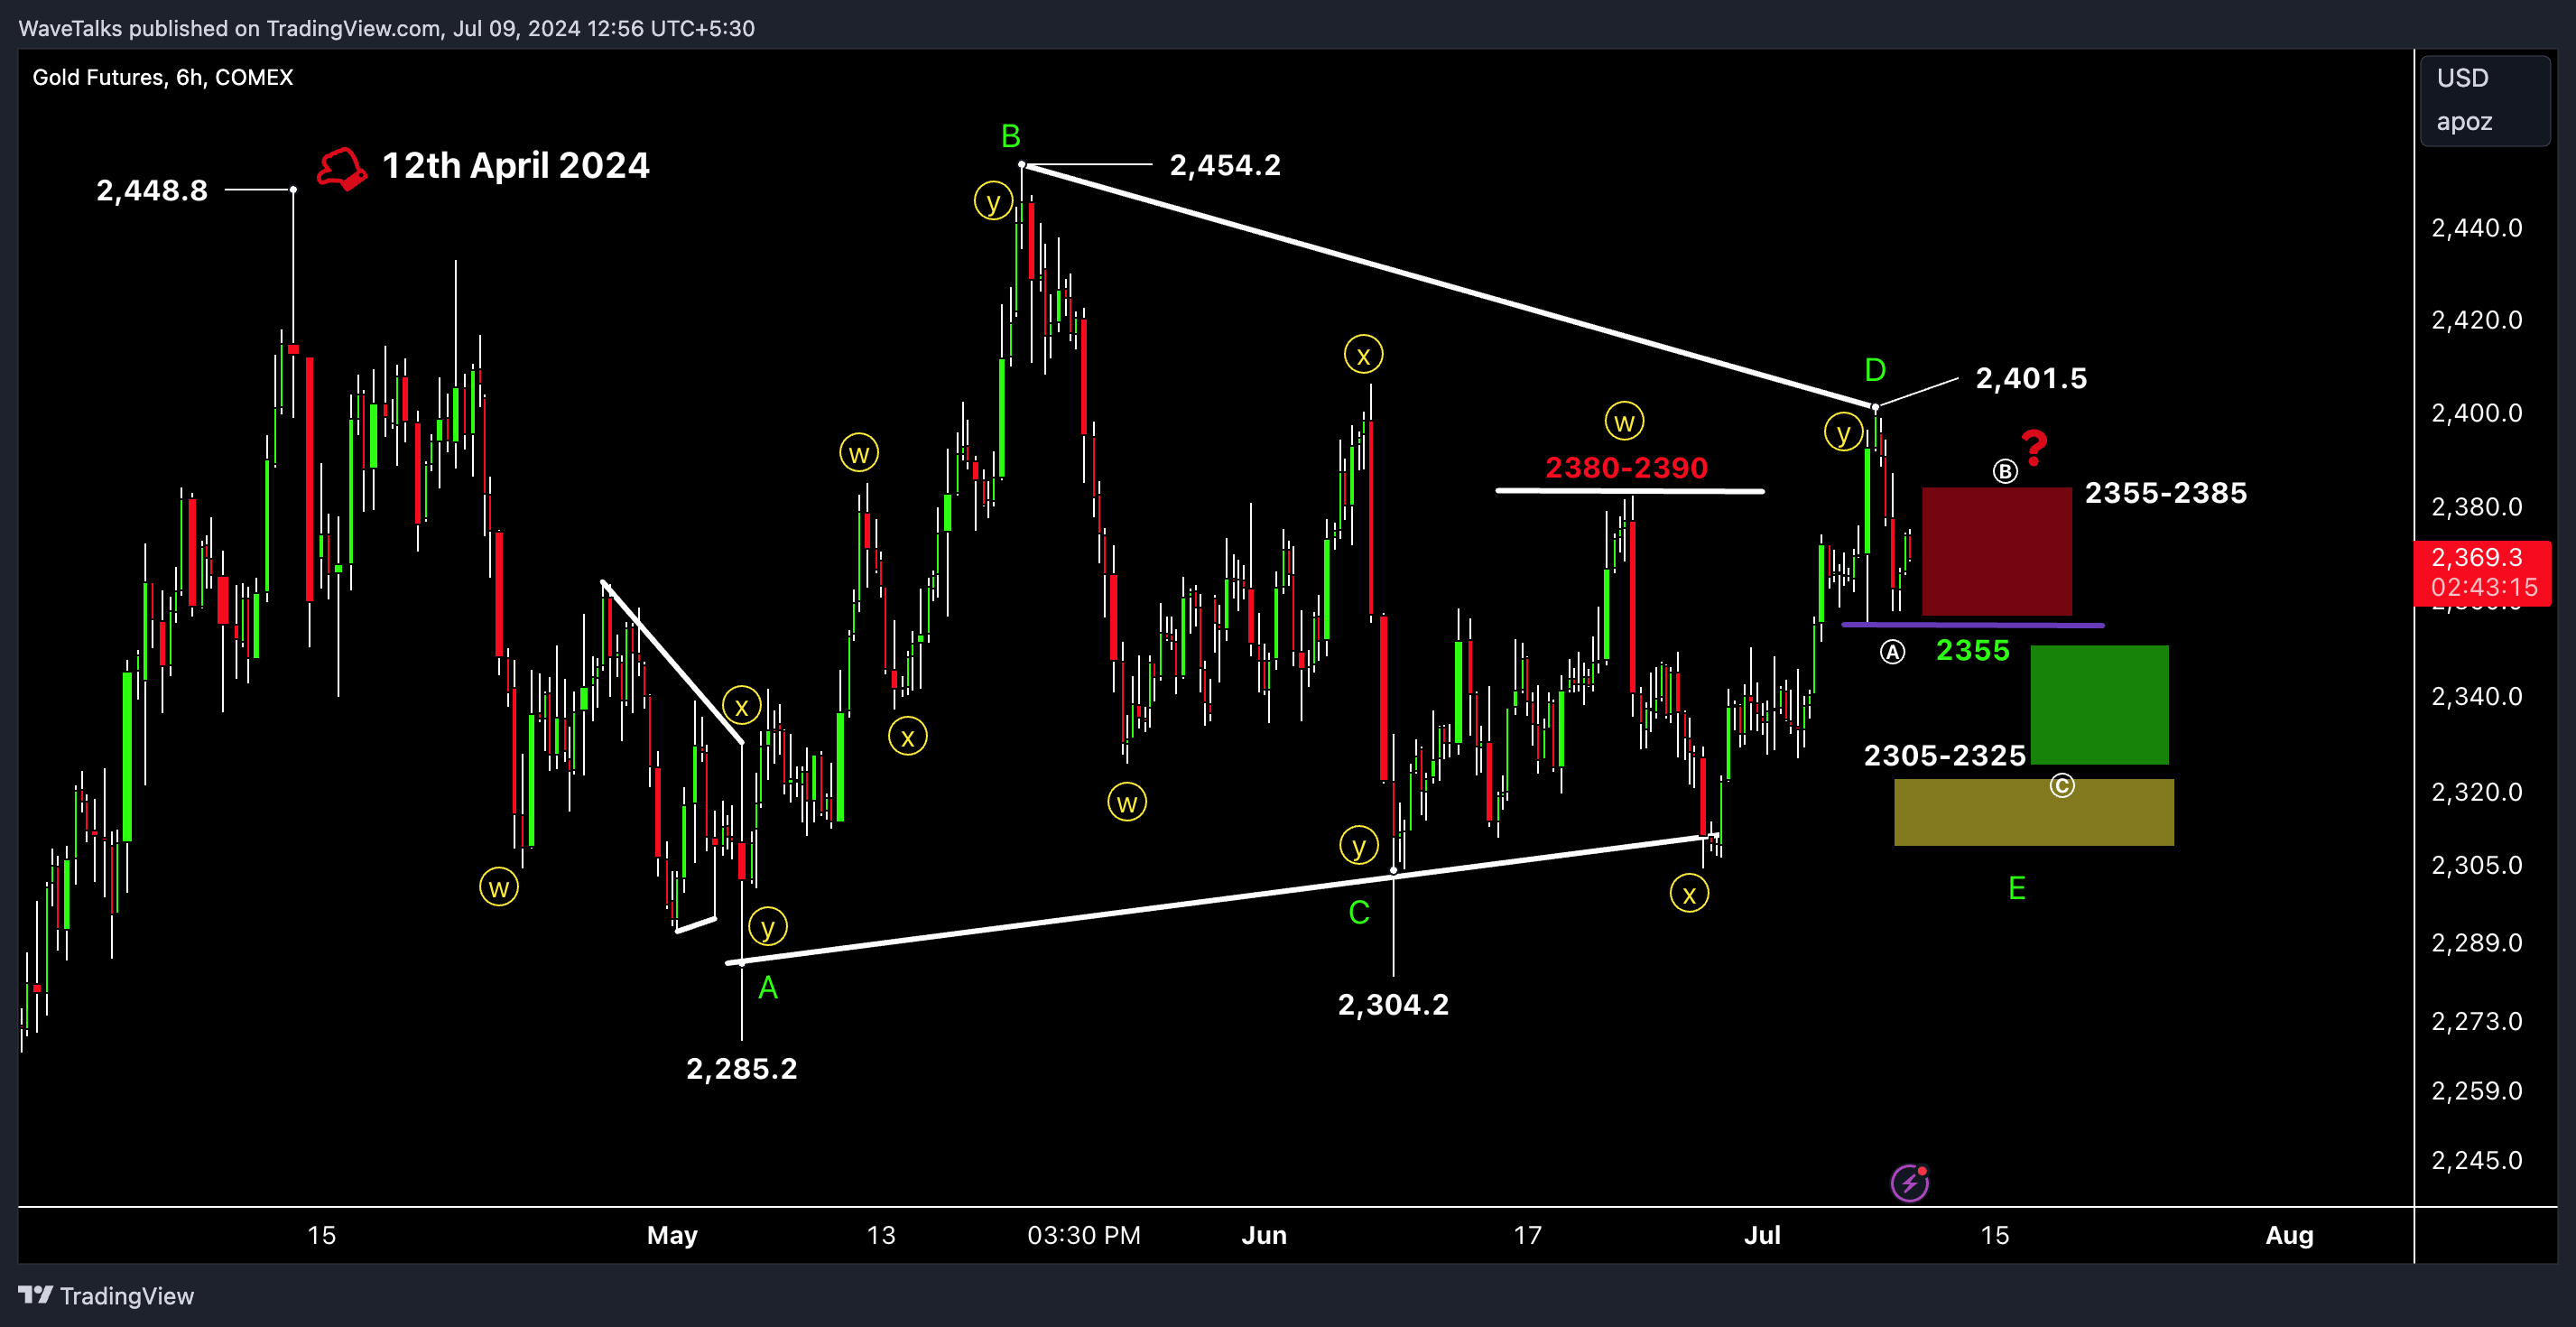
Gold has been in a big range, doing a series of connecting waves, narrowing down like a tightened coil. Once coil unfolds in near future post completing Wave-E of the proposed Triangular Structure, next move could be sharp on either side of the critical zones discussed.
Irregular triangle
-
Wave-B: Surpassed highs of 2448 (starting point for Wave-A).
-
New highs: 2454 (slightly above Wave-A).
This falls into the category of an irregular structure where Wave-B surpasses Wave-A.
Higher lows
Rising lows can provide comfort to Bulls until it holds above 2285.
-
Wave-A bottomed: 2285.
-
Probable wave-C completed: 2304 (June 7, 2024).
-
Recent bounce: 2304 (June 26, 2024).
-
Key resistance level: 2401 USD (as of July 5, 2024).
Assuming Wave-D is completed, we have a key resistance at 2401.
Falling in wave-E - triangle trap
The fall has been sharp from the highs of 2401 (assuming Wave-D completed) on the first trading day of the week (July 8-12, 2024), looking to be a corrective fall taking support at 2355 USD (minor support level).
Where are we currently (9th July 2024)
Currently, Gold is within unfolding Wave-E of the structure & completed the first lower degree wave Ⓐ at 2356 lows & unfolding wave Ⓑ now & later wave Ⓒ
Zone one (Shown in red)
-
Short-term range: 2355 to 2385.
Zone two (Shown in green)
-
Short-term minor support zone: 2305 to 2325.
Move looks to be range-bound, holding the minor support level of 2355 (marked as wave Ⓐ) and can have a bullish bias towards the minor resistance level of 2385. Breaching the zone of 2350 / 2355, the minor support zone of 2305-2325 on the downside will open up.
Key support and resistance zones
-
Key & critical support zone: 2285-2305.
-
Key resistance zone: 2400-2410.
-
Critical resistance zone: 2448-2455.
Any move either side of the key & critical zones could be sharp moves & has to be reviewed once we get further price inputs.
Conclusion
Waiting for Wave-E to complete in the sideways move in which Gold has been trapped since April 2024.
Wave-E could take 1-2 weeks.
Catch me in the next episode of WaveTalks. Have a great week ahead.
Author

Abhishek H. Singh
WaveTalks
Abhishek is a seasoned financial analyst with over a decade of experience specializing in Elliott Wave Theory.


