This is not a correlated market [Video]
![This is not a correlated market [Video]](https://editorial.fxstreet.com/images/TechnicalAnalysis/Intermarket/Correlation/greasy-gears-in-the-machine-gm503847604-82780433_XtraLarge.jpg)
US Dollar: March USD is Down at 97.340.
Energies: Feb'20 Crude is Down at 57.98.
Financials: The Mar'20 30 year bond is Up 26 ticks and trading at 158.03.
Indices: The March SP 500 emini ES contract is 59 ticks Lower and trading at 3310.25.
Gold: The Feb'20 Gold contract is trading Down at 1556.80. Gold is 35 ticks Lower than its close.
Initial Conclusion
This is not a correlated market. The dollar is Down- and Crude is Down- which is not normal but the 30 year Bond is trading Higher. The Financials should always correlate with the US dollar such that if the dollar is lower then bonds should follow and vice-versa. The SP is Lower and Crude is trading Lower which is not correlated. Gold is trading Lower which is not correlated with the US dollar trading Down. I tend to believe that Gold has an inverse relationship with the US Dollar as when the US Dollar is down, Gold tends to rise in value and vice-versa. Think of it as a seesaw, when one is up the other should be down. I point this out to you to make you aware that when we don't have a correlated market, it means something is wrong. As traders you need to be aware of this and proceed with your eyes wide open.
At this time all of Asia is trading Lower. Currently all of Europe is trading Lower as well.
Possible Challenges To Traders Today:
-
No Major Economic News.
-
Lack of Major Economic News
Treasuries
We've elected to switch gears a bit and show correlation between the 30 year bond (ZB) and The S&P futures contract. The S&P contract is the Standard and Poor's and the purpose is to show reverse correlation between the two instruments. Remember it's liken to a seesaw, when up goes up the other should go down and vice versa.
On Friday the ZB made a major move at around 9:30 AM EST. The ZB hit a Low at around that time and the S&P moved Lower. If you look at the charts below ZB gave a signal at around 9:30 AM EST and the S&P moved Lower at the same time. Look at the charts below and you'll see a pattern for both assets. ZB hit a Low at around 9:30 AM and the S&P was moving Lower shortly thereafter. These charts represent the newest version of MultiCharts and I've changed the timeframe to a 15 minute chart to display better. This represented a Long opportunity on the 30 year bond, as a trader you could have netted about 15 ticks per contract on this trade. Each tick is worth $31.25. Please note: the front month for the ZB is now March '20. The S&P contract is also March '20. I've changed the format to Renko bars such that it may be more apparent and visible.
Charts Courtesy of MultiCharts built on an AMP platform
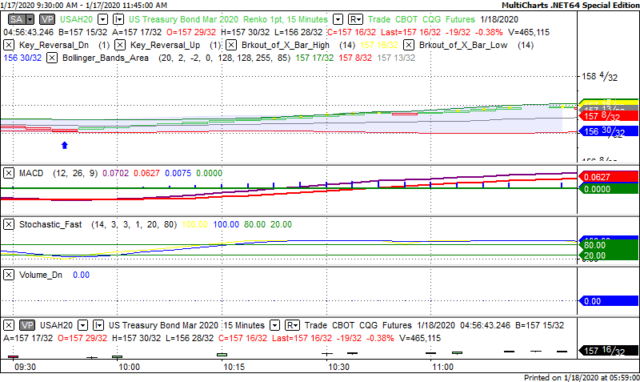
ZB - March, 2020 - 1/17/20
SP March 2020- 1/17/20
Bias
On Friday we gave the markets a Neutral bias as the instruments we use for Market Correlation purposes weren't correlated, hence the Neutral bias. The Dow gained 50 points and the other indices gained ground as well. Today we aren't dealing with a correlated market and our bias is Neutral.
Could this change? Of Course. Remember anything can happen in a volatile market.
Commentary
Apparently the markets wanted to continue its upward trend as all the indices closed Higher on Friday. I guess traders wanted to start a 3 day weekend off with a pop and they did. Today we have the Senate Impeachment trial that is scheduled to begin. The question is what kind of a trial will it be? Will the Senate allow testimony from witnesses or will they perform the trial without such. A few GOP senators have already stated that they want witness testimony as without such it wouldn't be viewed as fair. The other question is how will the markets react to all of this? From our perspective we will just follow our rules on Market Correlation. Time will tell how it all works out.
Author

Nick Mastrandrea
Market Tea Leaves


