Trend P.I. Results & Update: S&P 500 had a change in trend point

Week of 1/31 - The S&P continued to rally to near the 2/02 close, reaching very close to a .618 retracement of the entire move down in January. From that high the S&P declined sharply into a 2/04 AM low, which coincided with Mercury turning direct. From that low, the S&P rallied about 90 handles into a 3:10 PM high. This was followed by a 40 handle decline into the close.
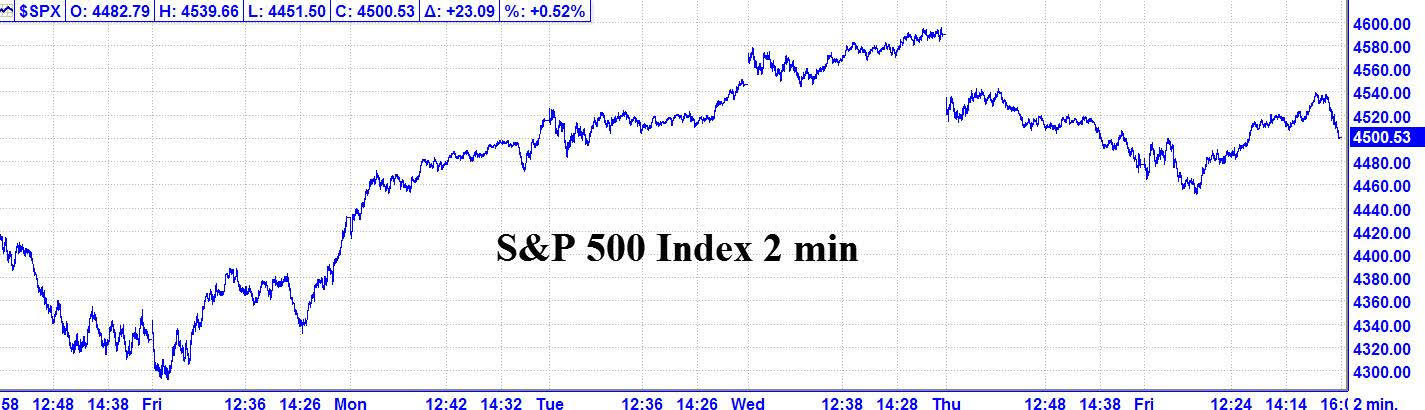
2/04 – The major indices, following a very strong rally into 3:10 PM, gave back almost half of this with a 40 handle decline into the close. This left the major indices, on average, with a moderate up day, but somewhat mixed with the following closes:
INDU – 21.42; S&P 500 + 23.09; and the NASDAQ Composite +,219.19.
Looking ahead - We had a change in trend point due 2/04 PM and we got a high. The market declined sharply into the close. Now, we have a change in trend due for over the 2/04 weekend. This is not a high confidence setup, so I am leaning slightly to a low for 2/07 AM.
Please see the change in trend points below.
The Now Index is in the NEUTRAL ZONE.
Coming Events:
(Stocks potentially respond to all events).
- A. 01/28 AC – Venus in Capricorn goes Direct. Major change in trend Cattle, Coffee, Copper, Cotton, Sugar, &
Wheat.
- 01/28 AC – Jupiter 90 US Ascendant. Important change in trend US Stocks, T-Bonds, US Dollar.
- 01/31 AC – New Moon in Aquarius. Major change in trend Financials, Grains, Precious Metals and Copper.
- 02/02 PM – Jupiter 150 US North Node. Moderate change in trend US Stocks, T-Bonds, US Dollar.
- 02/03 AC – North Node 45 US Sun. Moderate change in trend US Stocks, T-Bonds, US Dollar.
- 2/03 AC – Mercury in Capricorn turns Direct. Major change in trend Coffee, Corn, Oats, Soybeans, Wheat.
- 2/04 PM – Saturn Parallel US MC. Major change in trend US Stocks, T-Bonds, US Dollar.
- 2/04 AC – North Node 120 US Pluto. Major change in trend US Stocks, T-Bonds, US Dollar.
- 2/07 AC – Jupiter 90 US Uranus. Major change in trend US Stocks, T-Bonds, US Dollar.
Stock Market Key Dates –
Market Math –
2/03/22– 20,449 (143^2) days from the 2/09/1966 major high.
2/17/22 – 729 (27^2) from the 2/19/2020 major high.
2/22/22 – 12,544 (112^2) days from the 10/20/1987 major low.
DJIA* – 1/31, 2/7, 2/14, 2/22
S&P 500* - 1/31. 2/25
Fibonacci – 2/6, 2/15-16, 2/18
Astro – 1/31, 2/7, 2/14, 2/16, 2/18, 2/22, 2/23, 2/24
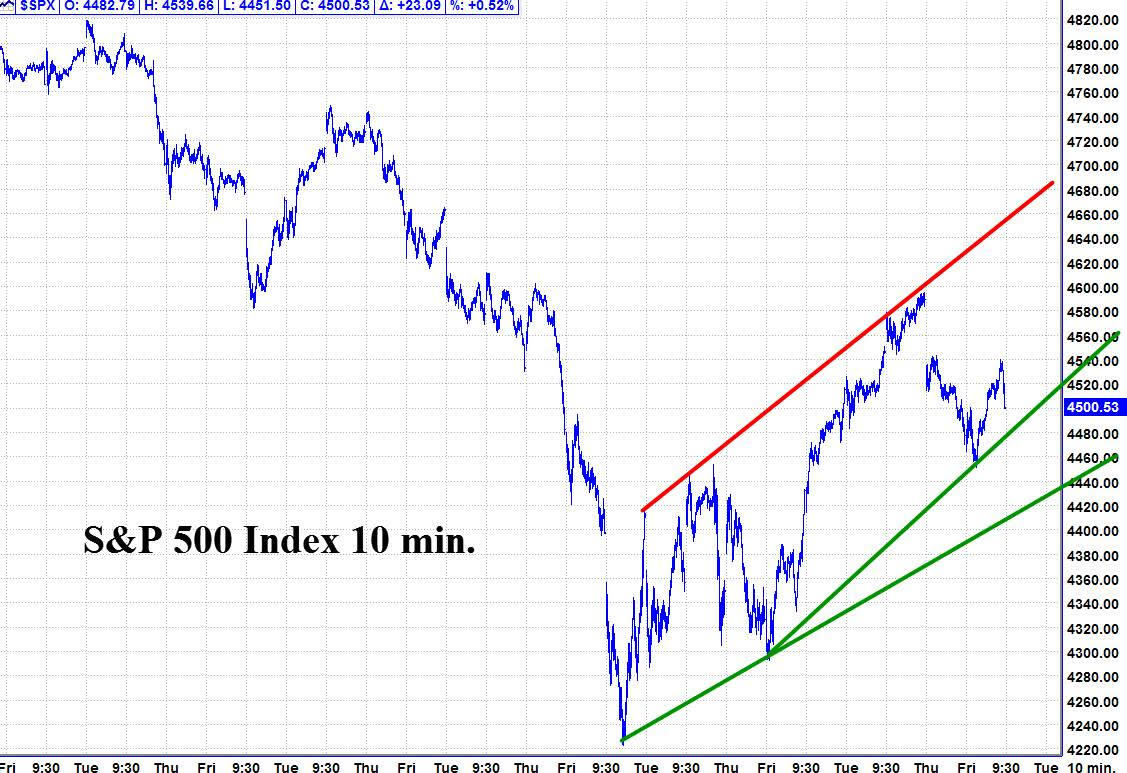
Please see below the S&P 500 10 minute chart.
Support - 4480, 4420 Resistance – 4600, 4680
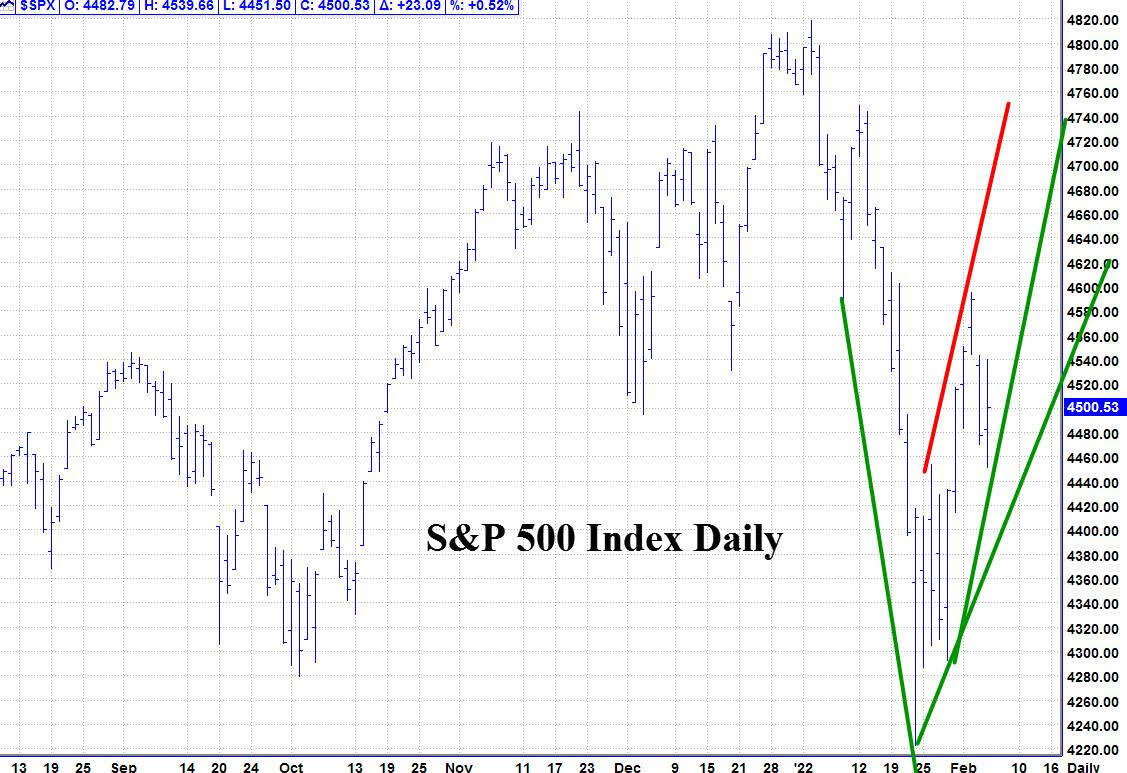
Please see below the S&P 500 Daily chart
Support - 4480, 4420 Resistance – 4600, 4680
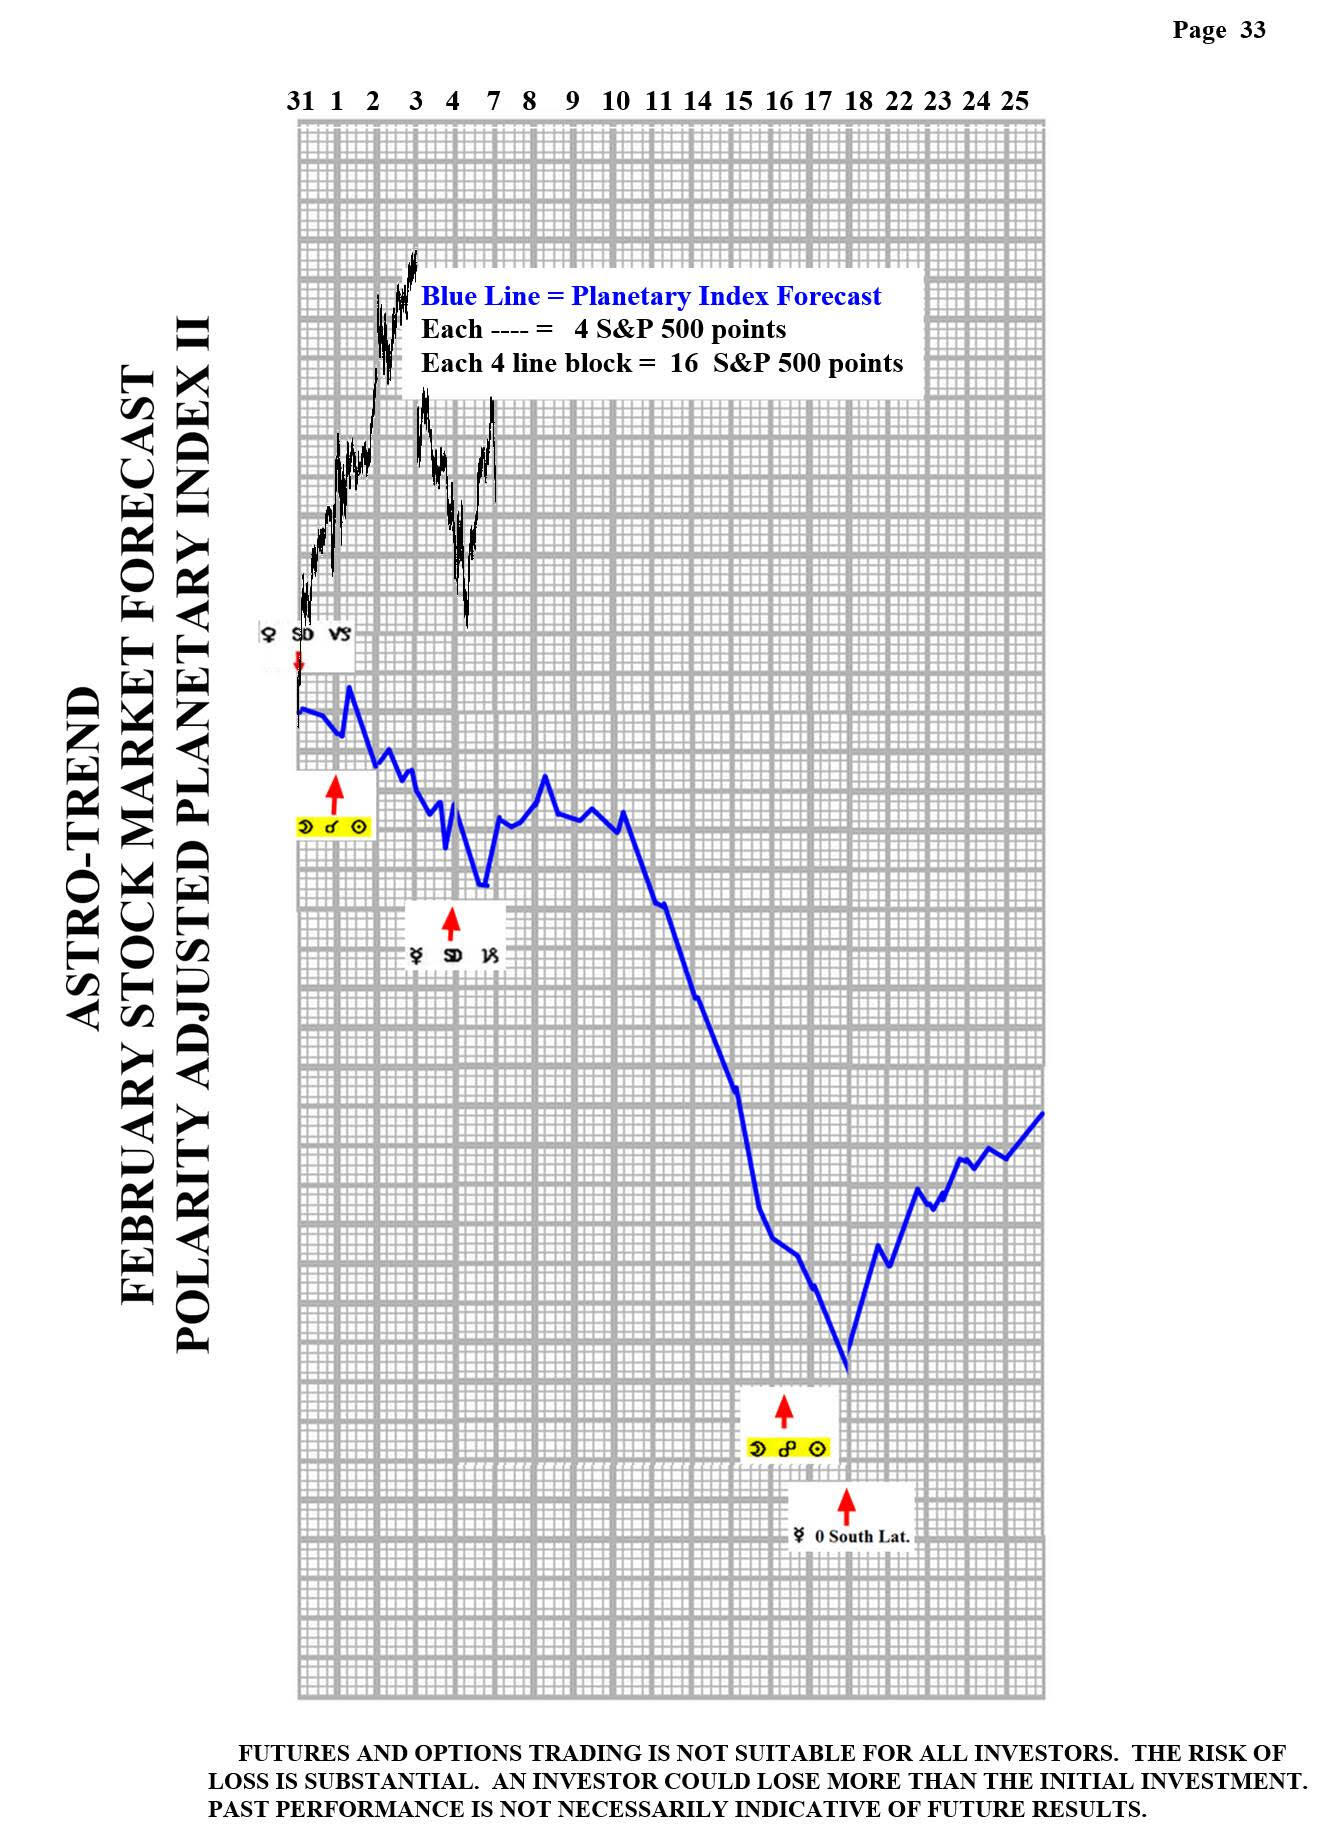
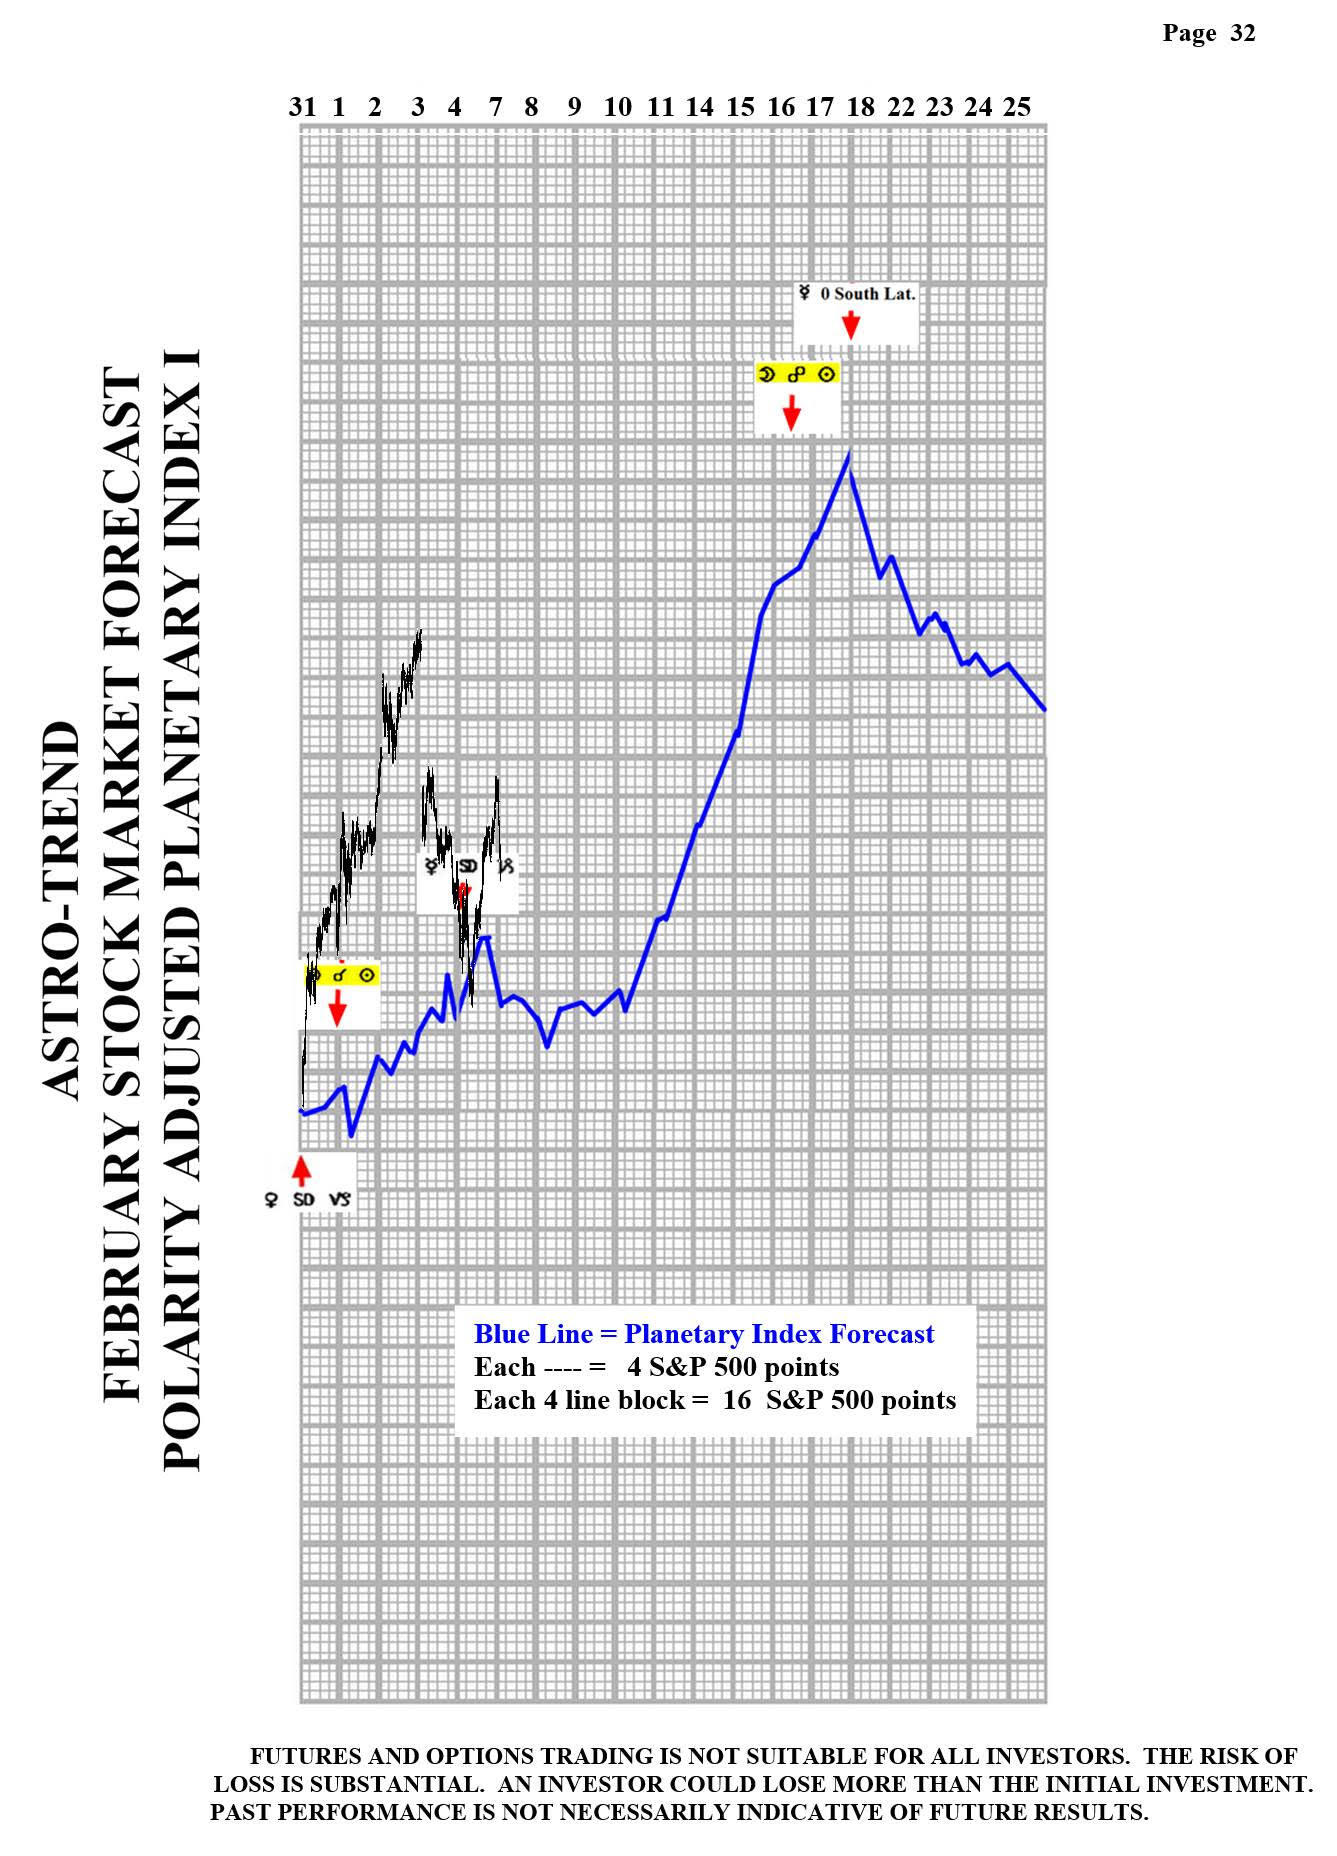
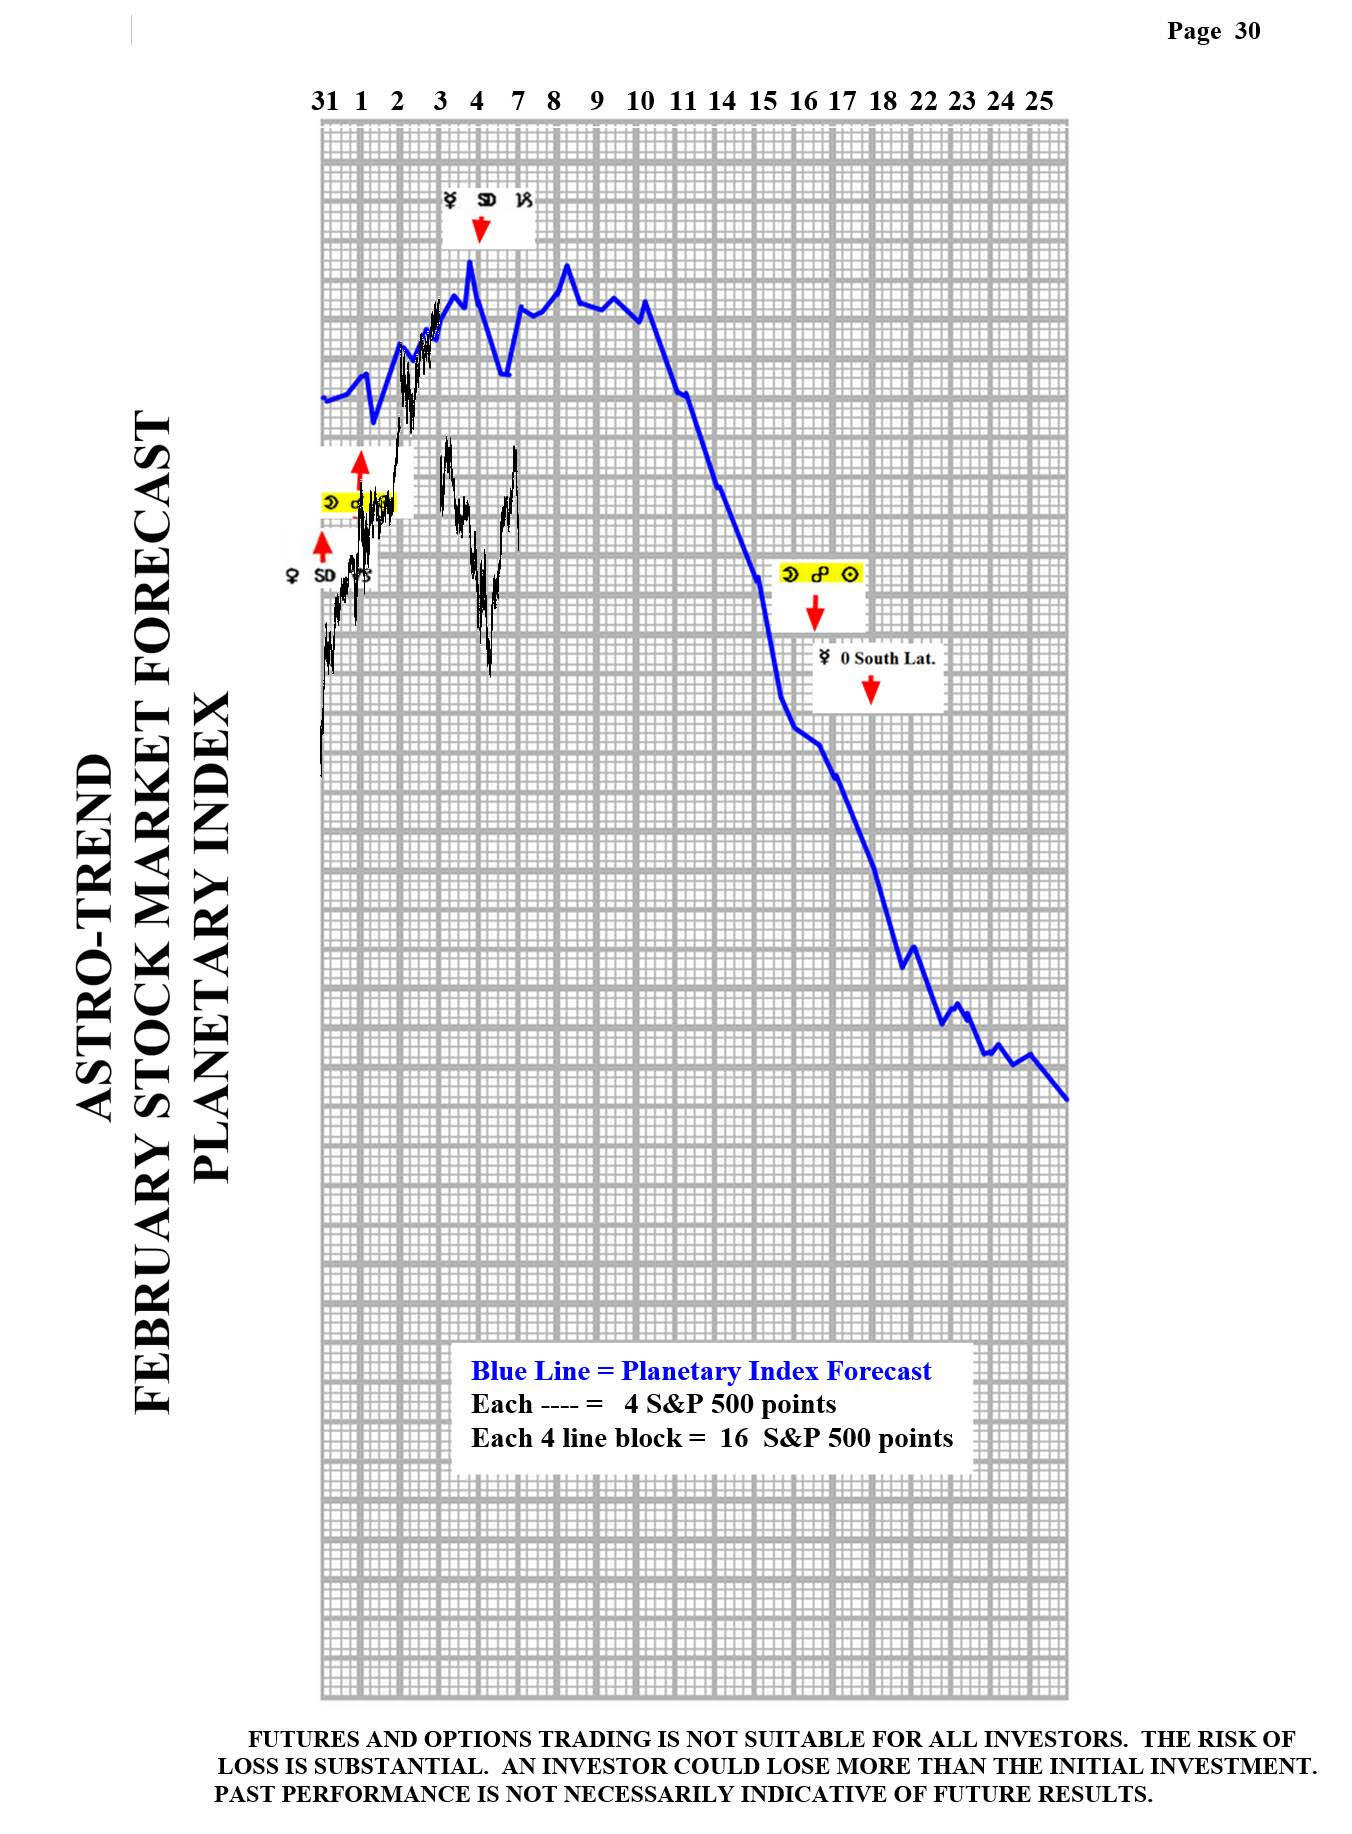
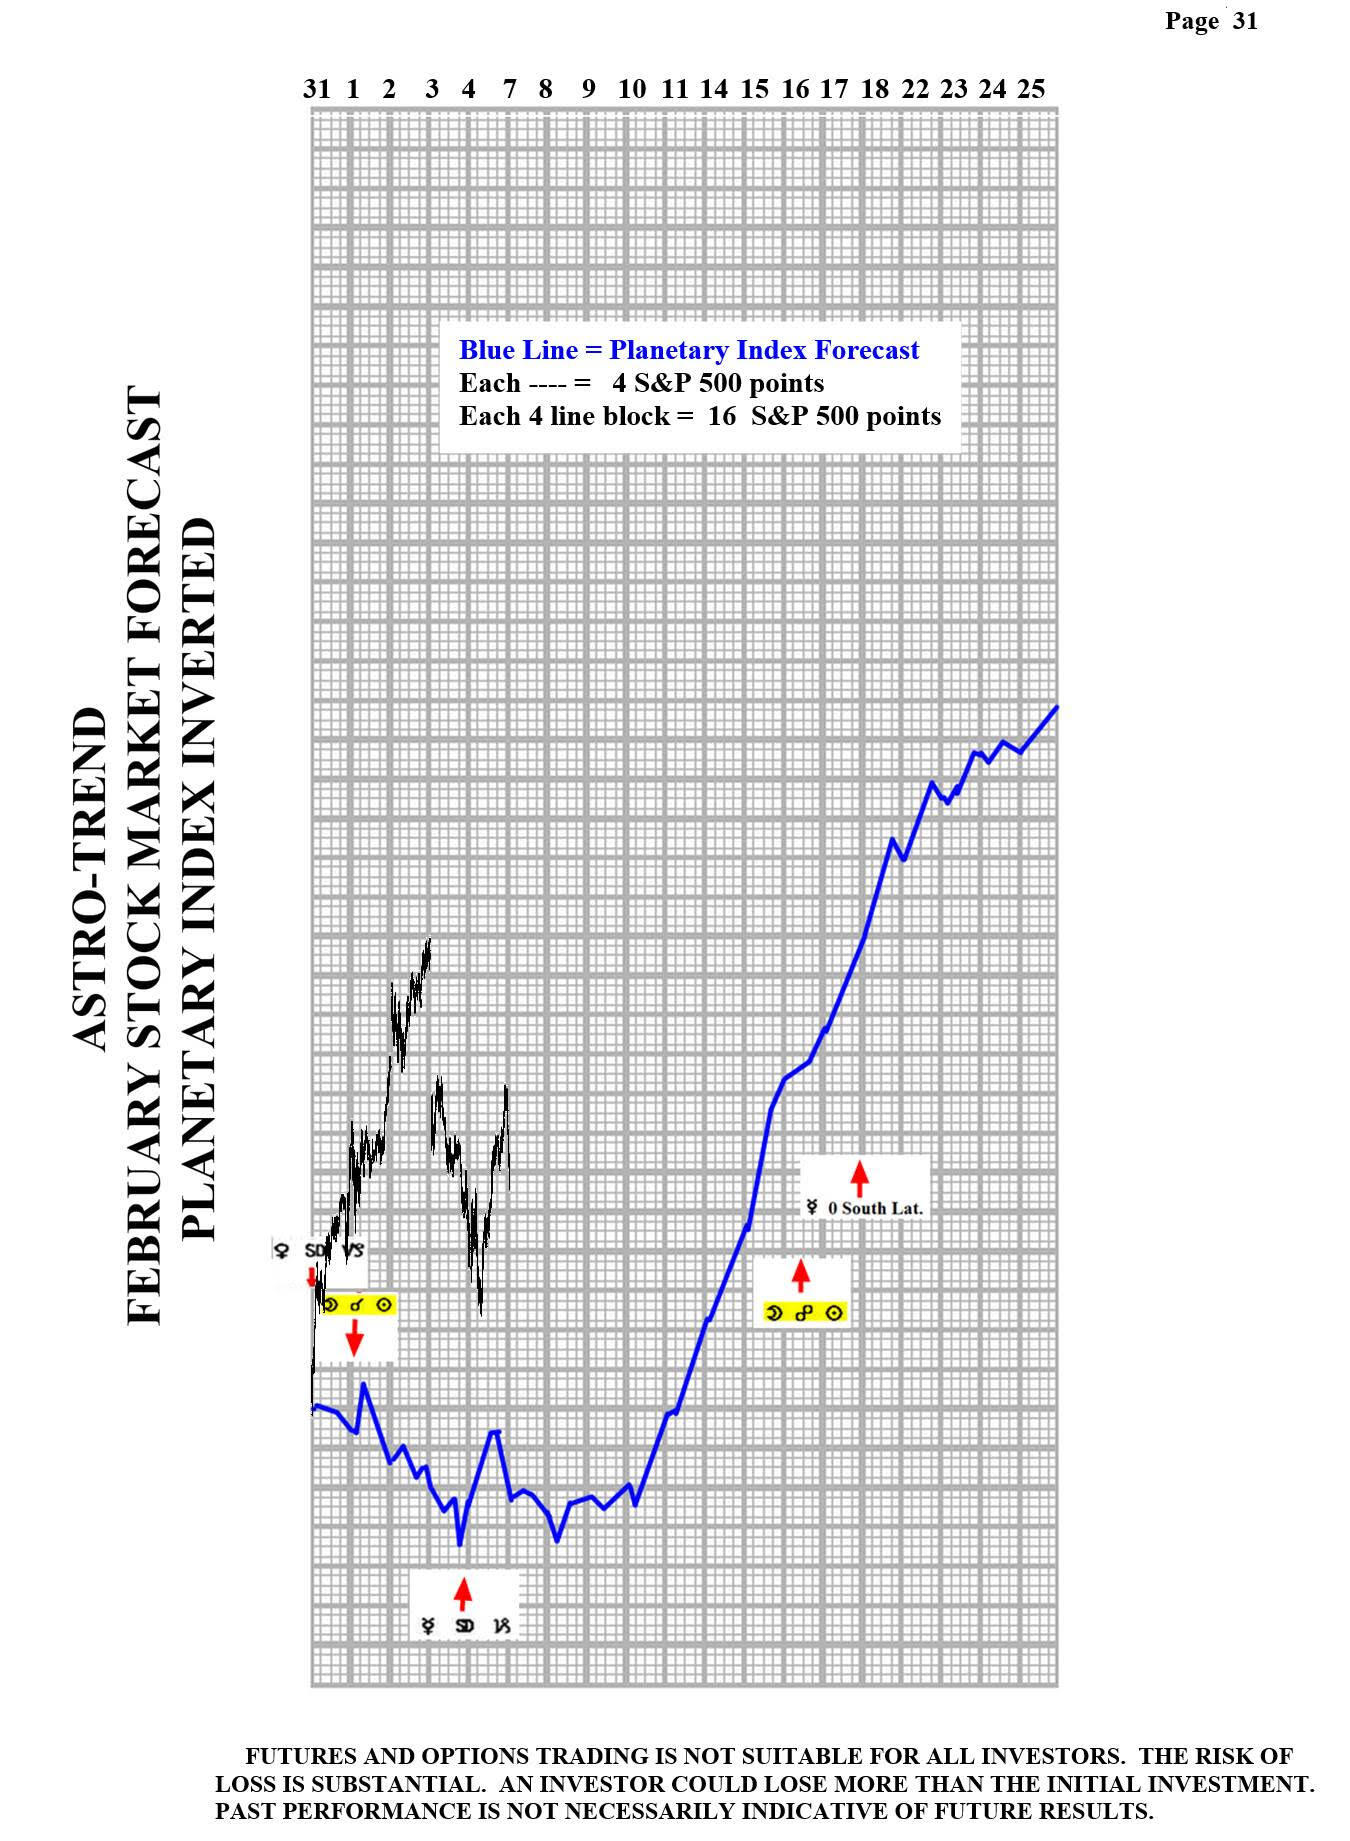
Please see below the January Planetary Index charts with S&P 500 5 minute bars for results.
Author

Norm Winski
Independent Analyst
www.astro-trend.com


