Treasury yields and the dollar struggle amid tax reform concerns

Market Overview
Markets have entered into a very tentative mode of trading since the FOMC meeting on Wednesday. Concerns over subdued inflation continue to hamper any trending move for the dollar, whilst uncertainty over the progress of US tax reform is also hindering. The dollar has lost the impetus in its rally and is threatening to turn corrective again, certainly against the yen. There is an air of uncertainty that is engulfing across several of the major pairs, whilst gold is also into a bit of a crossroads. This comes amid news that the negotiations over tax reform in the Congress are struggling to come to an agreement that can pass the simple majority vote again. Some Senators on the Republican side are questioning their support for the bill in its revised form. The result has been for Wall Street to turn lower and Treasury yields to once more drop back as the 10 year yield is back around 2.35% again. The dollar will really struggle to gain sustainable traction if a decisive move above 2.40% cannot be achieved. The ever-beleaguered UK Prime Minister Theresa May travels to Brussels today for the EU Council meeting in an attempt to formally have the EU sign off for the move to the next stage of Brexit-negotiations.

Wall Street closed lower having posted an all-time high, with the S&P 500 -0.4% at 2652, with the Asian markets were across the board (Nikkei -0.6%) and European markets all opening lower again. In forex, the dollar is weaker against all the majors, with the Aussie and especially the Kiwi performing well. For commodities, the weakness of the dollar is helping to support gold by $3, whilst oil has held on to yesterday’s gains.
Friday ends another big week of economic data on rather a quiet note today. There is very little to disturb traders during the European morning, and it is not until the New York Fed manufacturing at 1330GMT that there is much to impact on the markets. Expectation is that the Empire State Manufacturing will come back slightly to 18.8 (from 19.4 last month) which although would still be strong, would be the lowest reading since July. The US Industrial Production numbers are released at 1415GMT and are expected to show +0.3% for the month (after growing by +0.9% last month). Capacity Utilization is expected to improve to 77.2% which would be a 2 year high (up from 77.0 last month).
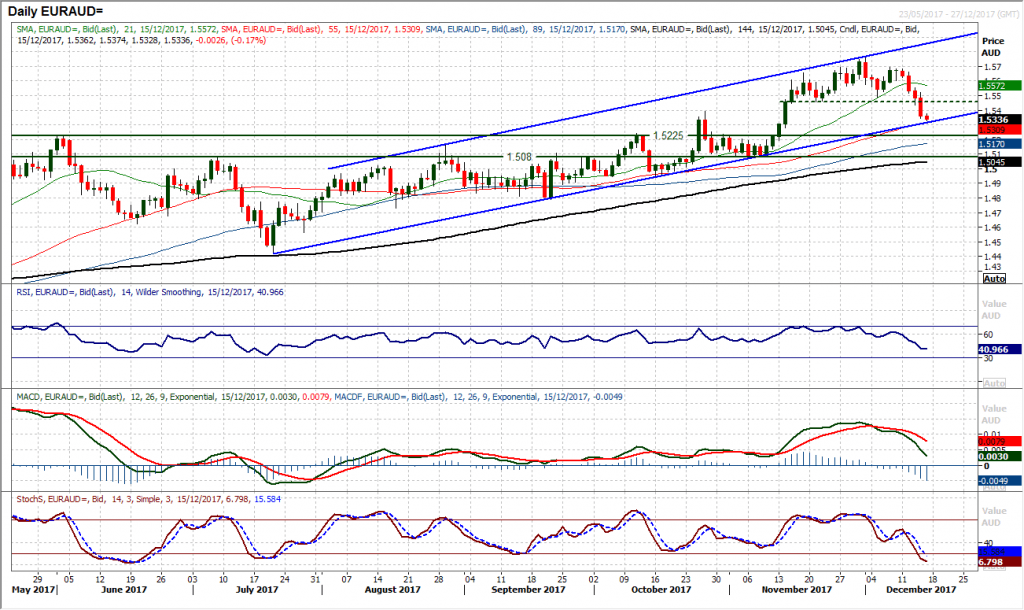
Chart of the Day – EUR/AUD
There Aussie has seen a significant shift in sentiment across the G4 majors (dollar, euro, yen and sterling) in the past few days. Some of the moves have had a significant impact on the medium term outlook. On Euro/Aussie we have seen the market complete a head and shoulders top pattern on a move below 1.5455 which implies 280 pips towards 1.5210 in the coming weeks. The market should now in the least come back to test the support of the 5 month uptrend channel (currently 1.5315). Furthermore, a retreat into the longer term pivot band 1.5080/1.5225 now seem likely. The deterioration in the outlook comes with the acceleration lower on the MACD and Stochastics lines, whilst the RSI has fallen below 50 to a near three month low. Near term rallies now become a selling opportunity for a pullback to the neckline resistance 1.5455/1.5490. The hourly chart shows any unwinding move on the hourly RSI into 50/60 is a chance to sell, with initial resistance at 1.5415.
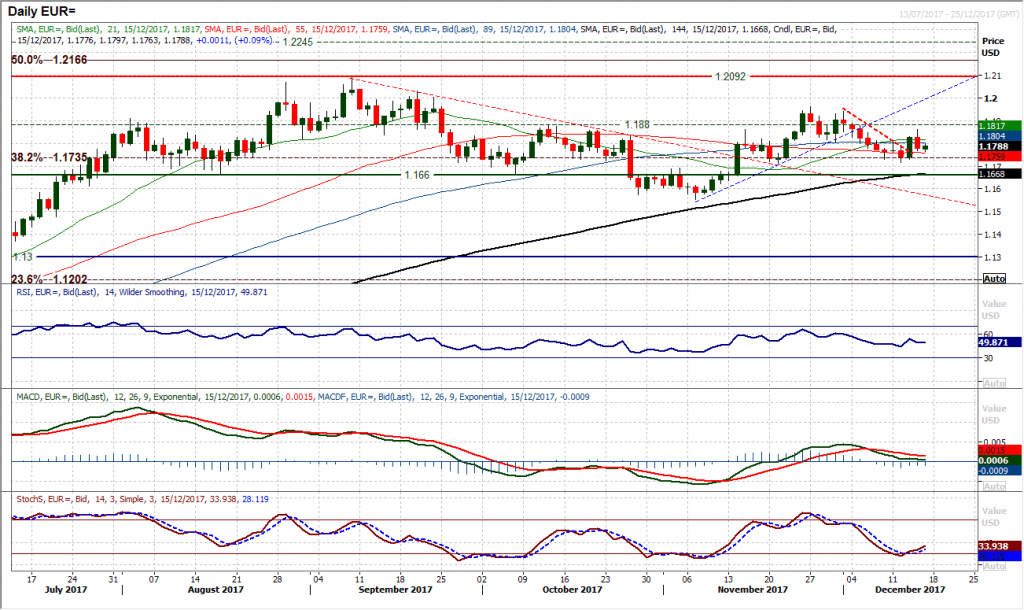
EUR/USD
Despite a minor bout of dollar weakness seen across forex majors, the euro weakened in the wake of the ECB meeting yesterday and pulled EUR/USD back lower again. A loss of around 50 pips on the day has left another lower high around $1.1860 for a market that is increasingly choppy and lacking direction. The momentum indicators on the daily chart reflect this with the RSI flattening around 50 and the MACD lines hovering now just above neutral. The market is also back around a clutch of flat moving averages and is looking for another catalyst. The hourly chart is giving little else in terms of direction and it is interesting to see the near term pivot again around $1.1800/$1.1810 as a basis of resistance yesterday afternoon. Support at $1.1715 is key with resistance above $1.1810 at $1.1860. Very much a wait and see situation.
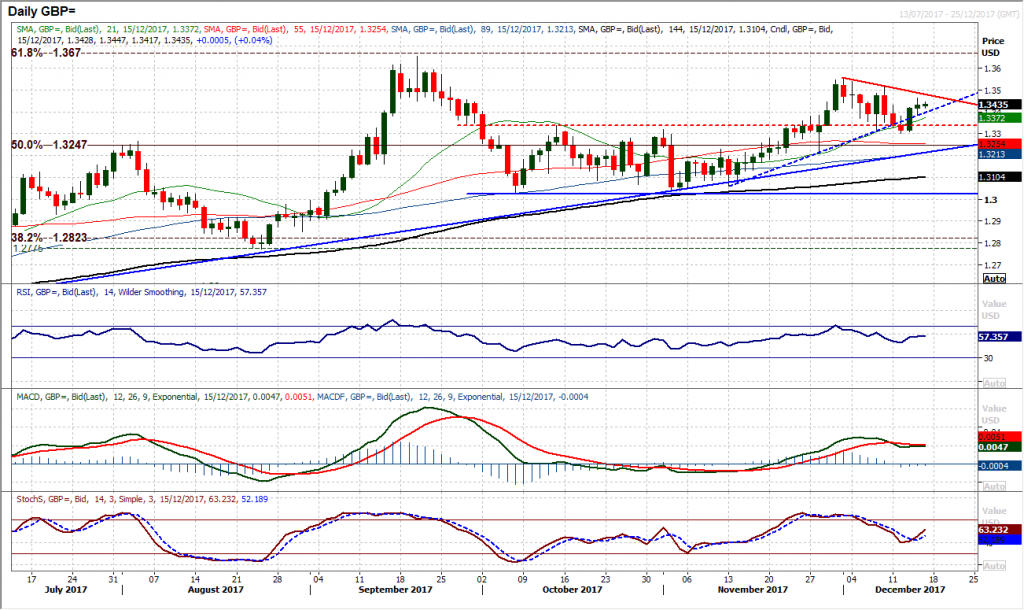
GBP/USD
Cable is another chart which is searching for direction after a series of mixed signals. A broken uptrend and support breach only to rally again. However the bulls could not quite get away yesterday and only a minor positive candle resulted. The early move today is also reflecting a consolidation. The sterling bulls have averted the selling pressure for the time being but there is still a lack of conviction. Despite this though the daily indicators still show a positive bias. On the hourly chart the market there is a similar outlook with a degree of support forming above $1.3400 but seemingly in need of a catalyst to break the market higher above yesterday’s high at $1.3460. The concern for the bulls is that there is still a series of lower highs and lower lows over the past two weeks. Yesterday’s low at $1.3390 will become more important if the market fails to break higher again. Key support is in place now at $1.3300.
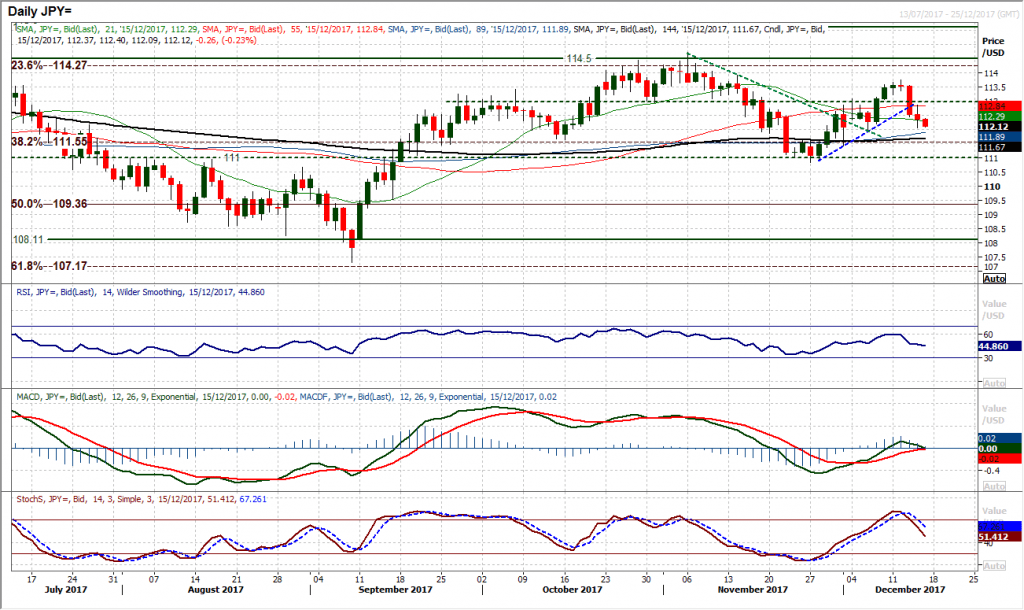
USD/JPY
The dollar is also struggling against the yen as the ranging conditions once more take hold. Wednesdays strong bear candle has been followed up by a subsequent negative session yesterday and the near term momentum indicators are now deteriorating. The failure to break back above the old breakout which has become resistance around 113.00 has again increased the pressure and the market is now dropping back towards a test of the support at 112.00. A breach of 112.00 opens the key medium term pivot of 111.00. The hourly chart shows a consistent theme in the past few days of decline followed by consolidation and then decline. The resistance is building overnight at 112.40 and with the negative configuration of the hourly RSI and MACD lines, rallies are now being used as a chance to sell. Subsequent resistance is at 112.80/113.00.
Gold
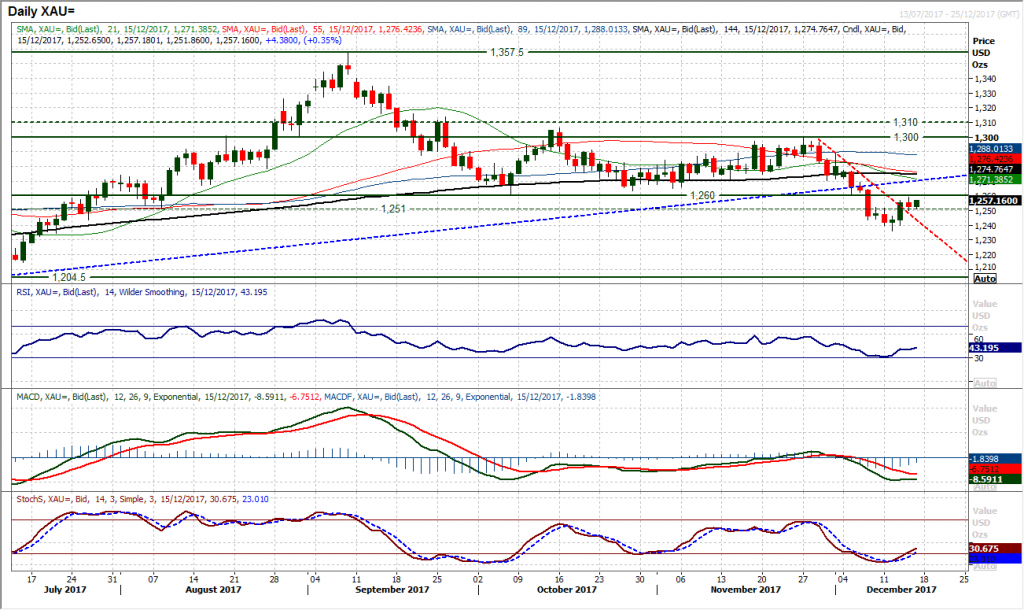
The market is holding on to the near term improvement in the outlook following the bullish candle of Wednesday. However it is interesting to see that gold is finding resistance around $1260 which was the breakdown resistance from the old key October low. Momentum indicators are picking up a touch to reflect the improvement but there is a sense still that this is a technical rally to unwind oversold momentum and will be seen as another chance to sell. Yesterday’s candle was a stuttering, slightly negative move and the market is consolidating today. The hourly chart shows a near term basis of support around $1250/$1252 and that the negative configuration on momentum has been calmed. The question is of how long the bulls sustain a rebound will the medium term indicators suggesting that rallies will be sold into. A decisive move back below $1250 re-opens the downside now towards $1236/$1240.
WTI Oil
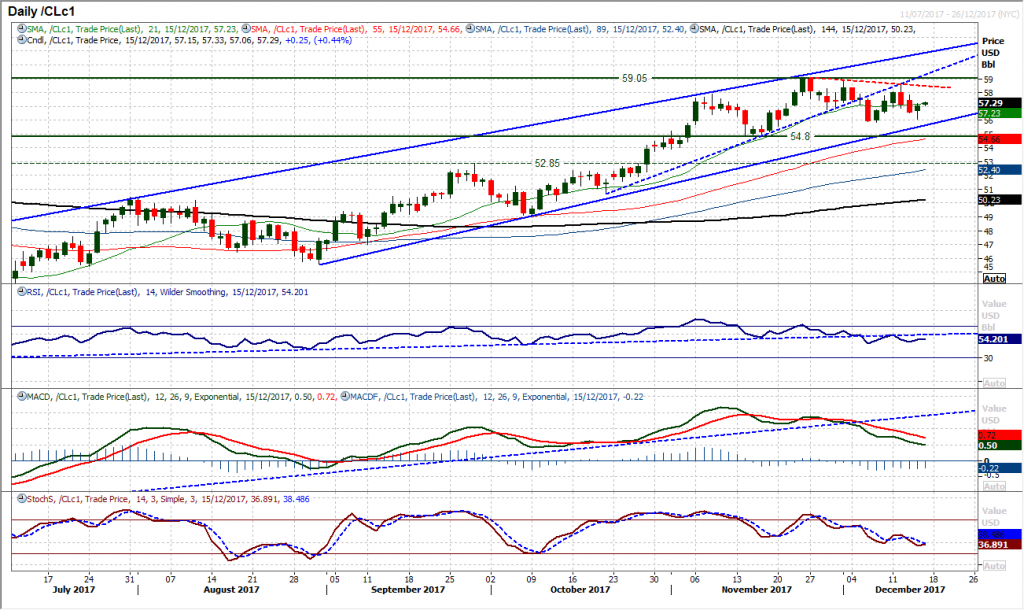
A positive reaction into the close last night has formed a positive candle that questions the near term corrective outlook within the four month uptrend channel. The channel support is coming ever closer and this is around the area that the bulls should be starting to think about supportive to maintain the medium term bullish trend intact. With the Average True Range c. $1.20 the market is now a little more than one bad session away from a key test, whilst the channel support comes in at $55.65 today. The daily momentum indicators suggest the market remains in corrective mode, with the MACD lines decisively in decline and the Stochastics having again just crossed lower. However with the rebound from $56.10 yesterday there is good support at $55.85/$56.10 now. The corrective outlook remains on the hourly chart with a head and shoulders top that implies around $1.70 down from $56.85 with the negative configuration on the hourly momentum studies, intraday rallies are increasingly being sold into. A move above $57.85 lower high would abort the near term corrective outlook now.
Dow Jones Industrial Average
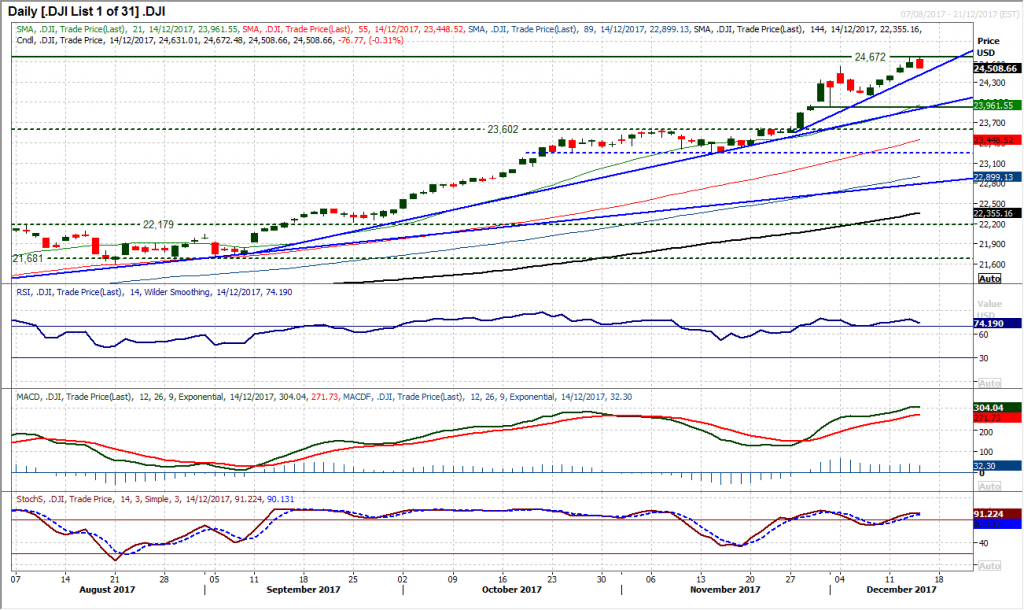
Although the market posted another intraday all-tie high yesterday at 24,672 a fall into the close hints at a potential near term correction now. A bearish engulfing candle (bear key one day reversal) suggests that at least in the near term, the bulls have lost impetus in the run higher and could open for some near term profit taking. For now the daily momentum indicators remain very strong although there is a very slight hint of perhaps a loss of impetus on the Stochastics. The hourly chart shows far more loss of momentum, but watch to see if the hourly RSI drops below 40 and the MACD lines go below neutral to see if the momentum builds in this correction. There is an initial support at 24,500 to be tested, with the first real support not until the reaction low at 24,100.
Author

Richard Perry
Independent Analyst


