Traders bearish on earnings

Good Morning Traders,
As of this writing 5:40 AM EST, here’s what we see:
US Dollar: June USD is Up at 99.745.
Energies: April'20 Crude Down at 20.22.
Financials: The June'20 30 year bond is Up 69 ticks and trading at 181.07.
Indices: The March S&P 500 emini ES contract is 300 ticks Lower and trading at 2494.00.
Gold: The April '20 Gold contract is trading Up at 1606.80. Gold is 100 ticks Higher than its close.
Initial Conclusion
This is not a correlated market. The dollar is Up+ and Crude is Down- which is normal and the 30 year Bond is trading Higher. The Financials should always correlate with the US dollar such that if the dollar is lower then bonds should follow and vice-versa. The S&P is Lower and Crude is trading Lower which is not correlated. Gold is trading Higher which is not correlated with the US dollar trading Up. I tend to believe that Gold has an inverse relationship with the US Dollar as when the US Dollar is down, Gold tends to rise in value and vice-versa. Think of it as a seesaw, when one is up the other should be down. I point this out to you to make you aware that when we don't have a correlated market, it means something is wrong. As traders you need to be aware of this and proceed with your eyes wide open.
At this time all of Asia is trading Lower. Currently all of Europe is trading Lower as well.
Possible Challenges To Traders Today:
ADP Non-Farm Employment Change is out at 8:15 AM. This is Major.
Final Manufacturing PMI is out at 9:45 AM EST. This is Major.
ISM Manufacturing PMI is out at 10 AM EST. This is Major.
ISM Manufacturing Prices is out at 10 AM EST. This is Major.
Construction Spending is out at 10 AM EST. This is Major.
Wards Total Vehicle Sales - All day
Crude Oil Inventories is out at 10:30 AM EST. This is Major.
Treasuries
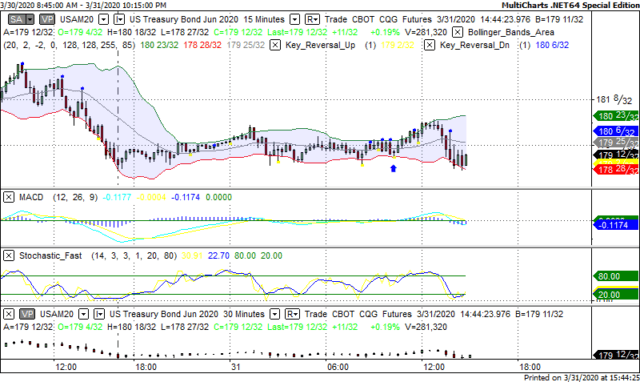
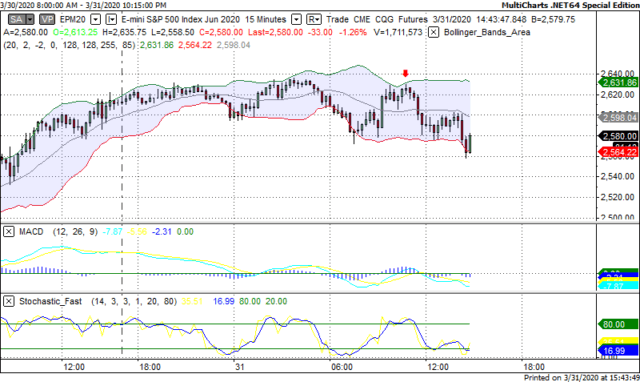
We've elected to switch gears a bit and show correlation between the 30 year bond (ZB) and The S&P futures contract. The S&P contract is the Standard and Poor's and the purpose is to show reverse correlation between the two instruments. Remember it's liken to a seesaw, when up goes up the other should go down and vice versa.
Yesterday the ZB made a move at around 10:15 AM EST. The ZB hit a Low at around that time and the S&P moved Lower. If you look at the charts below ZB gave a signal at around 10:15 AM and the S&P moved Lower at around the same time. Look at the charts below and you'll see a pattern for both assets. ZB hit a Low at around 10:15 AM EST and the S&P was moving Lower shortly thereafter. These charts represent the newest version of MultiCharts and I've changed the timeframe to a 15 minute chart to display better. This represented a Long opportunity on the 30 year bond, as a trader you could have netted about 30 plus ticks per contract on this trade. Each tick is worth $31.25. Please note: the front month for the ZB is now June '20. The S&P contract is now June '20 as well. I've changed the format to Renko bars such that it may be more apparent and visible.
Charts Courtesy of MultiCharts built on an AMP platform.
Bias
Yesterday we gave the markets an Upside bias as both the Bonds and Gold were trading Lower yesterday morning and this is usually indicative of an Upside day. The markets however had other ideas as the Dow dropped 410 points and the other indices lost ground as well. Today we aren't dealing with a correlated market and our bias is to the Downside.
Could this change? Of Course. Remember anything can happen in a volatile market.
Commentary
So yesterday prior to the markets opening many companies have suggested that they will not meet earnings expectations and this seemed to un-nerve the markets. Whereas the markets were so bullish on Monday, this turned to fear yesterday. Today we have about 8 economic reports, all of which are major so perhaps they can shift market direction; but as in all things only time will tell.
Author

Nick Mastrandrea
Market Tea Leaves


